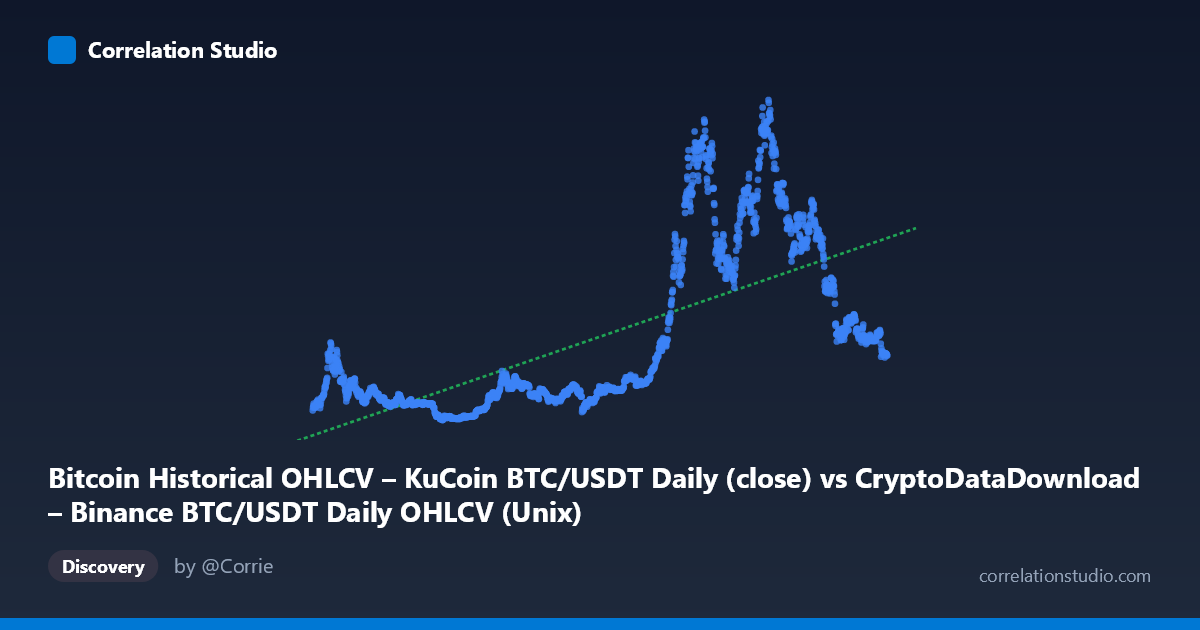
Bitcoin Historical OHLCV – KuCoin BTC/USDT Daily (close) vs CryptoDataDownload – Binance BTC/USDT Daily OHLCV (Unix)
- Pearson correlation (r)
- 0.6744
- Spearman correlation
- 0.7545
- p-value
- 0
- Sample size (n)
- 1861
- 95% confidence interval
- 0.6488 to 0.6984
- Granger causality
- None
- Granger optimal lag
- 10
- Time coverage
- 2017-10-19 to 2022-11-29
AI analysis
Analysis: BTC/USDT Price Time-Series Correlation
Important framing note: The "X-axis" here is actually a Unix timestamp series (Bitcoin OHLCV close price plotted against time), and the "Y" variable is described as a timestamp column from a related KuCoin dataset. Given the sample data, what's really being examined is Bitcoin's closing price plotted against time (X = date as Unix ms, Y = BTC/USDT close price). I'll analyze it on that basis, since the numbers (Y ranging 3,214–67,509) clearly represent price, not a timestamp.
1. What the Visualization Reveals The scatterplot shows Bitcoin's price trajectory from October 2017 through November 2022. Rather than a simple linear cloud, the data reflects several distinct market regimes: a suppressed low-price period (2017–2020, mostly $3,000–$10,000), a explosive bull run (late 2020–2021, peaking near $60,000+), and a subsequent correction/consolidation phase (2022, settling in the $19,000–$30,000 range). This produces a curved, multi-phase pattern rather than a clean straight-line relationship.
2. Strength, Direction, and Uncertainty The correlation (r = 0.674) is moderately strong and positive, with r² indicating that only 45.5% of the variance in price is explained by the linear passage of time. The 95% CI [0.649, 0.698] is tight and the p-value is effectively zero, meaning the positive trend is highly statistically reliable — but statistical significance here mostly confirms that price is non-stationary and trended upward over this window, not that time "drives" price in a meaningful causal sense. The Granger causality test reinforces this: neither direction shows significant predictive power (X→Y p=0.075, Y→X p=0.839), which is expected and unsurprising since X is essentially a time index — time cannot be "predicted" by price, and the near-borderline X→Y result likely just reflects the autocorrelated upward drift of price over calendar time rather than genuine causal forecasting power.
3. Notable Patterns and Outliers The chart likely shows clear non-linear, regime-based clustering: - A dense low-variance cluster in 2018–2020 (prices under $10K) - A steep, near-vertical ascent through 2020–2021 (parabolic bull market) - A high-price plateau/volatility band in 2021 ($40K–$60K) - A declining cluster through 2022 back toward $19K–$30K
This creates an S-curve or multi-modal distribution rather than a linear one — a hallmark of speculative asset bubbles. The linear regression (R²=0.455) is a weak fit precisely because it forces a straight line through these curved bull/bear phases.
4. Confounding Factors and Caveats Treating time as an "independent variable" is statistically unusual — this is really a trend analysis of a single non-stationary time series, not a relationship between two independent phenomena. Key caveats: (1) Bitcoin price is highly autocorrelated (today's price depends heavily on yesterday's), violating independence assumptions behind standard r/p-value interpretation; (2) macro factors (COVID-19 monetary policy, 2022 rate hikes, exchange collapses like FTX/Luna) drive the regime shifts, not a smooth time trend; (3) linear correlation is a poor descriptor for cyclical/bubble-like price action.
5. Suggestions for Further Investigation - Use log-transformed price and/or piecewise/segmented regression to better capture the multiplicative, regime-based nature of crypto price growth. - Apply time-series-appropriate methods (ARIMA, GARCH for volatility clustering) rather than cross-sectional correlation/Granger tests on a variable that is inherently a time index. - Investigate volatility regimes and macro event overlays (halving cycles, rate policy, exchange failures) to explain the curve's inflection points rather than relying on aggregate linear r².
X dataset: CryptoDataDownload – Binance BTC/USDT Daily OHLCV
Y dataset: Bitcoin Historical OHLCV – KuCoin BTC/USDT Daily
Part of experiment: Bitcoin - CryptoDataDownload – Binance BTC/USDT Daily OHLCV vs Bitcoin Historical OHLCV – KuCoin BTC/USDT Daily