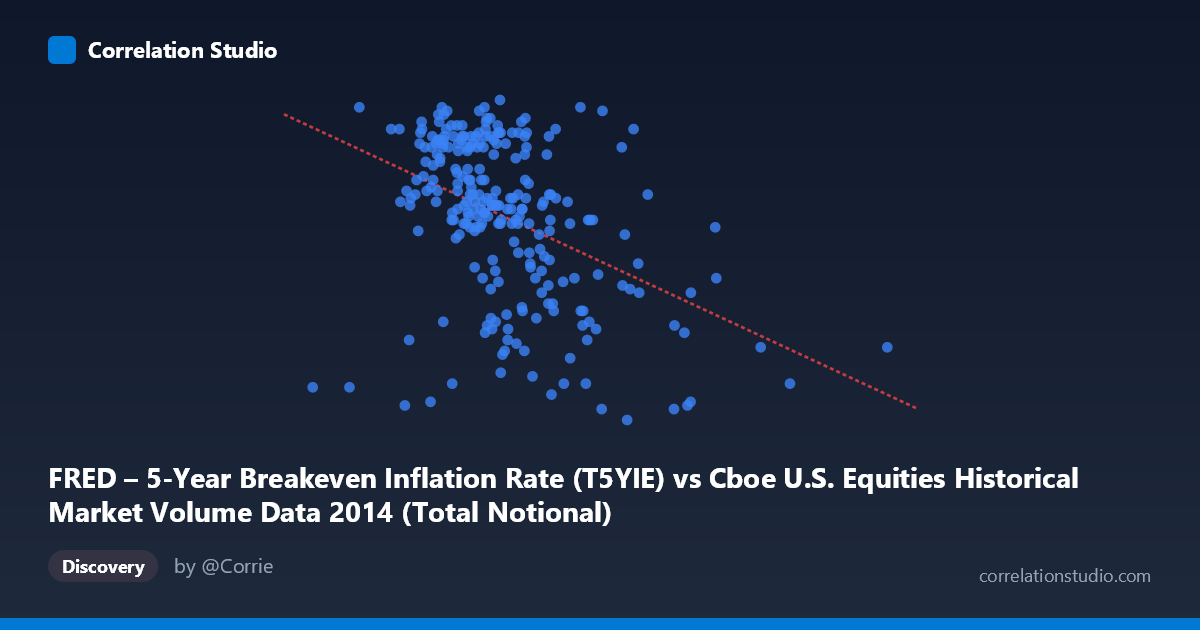
FRED – 5-Year Breakeven Inflation Rate (T5YIE) vs Cboe U.S. Equities Historical Market Volume Data 2014 (Total Notional)
- Pearson correlation (r)
- -0.4279
- Spearman correlation
- -0.434
- p-value
- 0
- Sample size (n)
- 250
- 95% confidence interval
- -0.5241 to -0.3208
- Granger causality
- None
- Granger optimal lag
- 1
AI analysis
Analysis: 5-Year Breakeven Inflation Rate vs. U.S. Equities Total Notional Volume (2014)
Relationship Overview
The scatterplot reveals a moderate negative relationship between U.S. equities total notional trading volume (X-axis) and the 5-year breakeven inflation rate (Y-axis) across 2014. The linear regression equation (y = -2.44×10⁻¹¹x + 2.16) confirms that as daily trading volume increases, the inflation expectation metric tends to decline. Visually, the data points show a discernible downward trend, though with considerable scatter throughout. The relationship is most pronounced at the extremes — days with very high notional volume (25 billion) tend to cluster at lower breakeven rates (~1.2–1.4%), while lower-volume days show a wider and generally higher spread of inflation expectations (~1.75–2.05%).
Correlation Strength and Statistical Significance
The Pearson correlation of r = -0.4279 indicates a moderate negative association, but the explanatory power deserves careful framing: r² = 0.183 means only 18.3% of the variance in breakeven inflation rates is explained by trading volume, leaving over 80% attributable to other factors. The 95% confidence interval of [-0.524, -0.321] is meaningfully narrow and entirely negative, reinforcing directional confidence. The p-value of 1.50×10⁻¹² is highly significant given n = 250 paired observations from a population of N = 3,686, making it extremely unlikely this correlation arose by chance. However, the Granger causality results are notably absent in both directions — neither X→Y (F = 0.408, p = 0.524) nor Y→X (F = 0.045, p = 0.833) reaches significance. This is a critical caveat: despite a statistically robust contemporaneous correlation, neither variable temporally predicts the other, suggesting the relationship is likely driven by common underlying factors rather than any direct causal mechanism.
Patterns, Clusters, and Outliers
Several structural features stand out in the data. There is a visible high-density cluster around the mean volume range (~15–20 billion) where breakeven rates span broadly from ~1.4 to 2.05%, indicating high variability at typical market conditions. A distinct lower-right cluster emerges for extreme volume days (25–27 billion), consistently associated with breakeven rates below 1.4% — these likely represent specific market stress or volatility episodes in 2014. One particularly notable outlier sits at approximately 37.8 billion in notional volume (the data maximum) paired with a breakeven rate of ~1.37%, which appears to be an extreme market event day. Additionally, the left portion of the chart (~8–12 billion range) shows breakeven rates predominantly above 1.75%, suggesting that quiet, low-volume trading days coincided with more stable, higher inflation expectations in this period.
Confounding Factors and Interpretive Caveats
Several confounds complicate causal interpretation. 2014 was a distinctive macroeconomic year marked by oil price collapse in Q4, Federal Reserve tapering of QE3, and geopolitical tensions — each capable of simultaneously suppressing inflation expectations and triggering elevated equity trading volumes. The breakeven inflation rate is itself a market-derived measure influenced by bond market liquidity and risk premiums embedded in TIPS, not just pure inflation expectations. High-volume equity days may proxy for broad market risk-off episodes that simultaneously pressure both equity valuations and commodity-linked inflation expectations. Furthermore, the dataset represents a single calendar year, and the observed correlation may not generalize across different market regimes. The lack of Granger causality despite contemporaneous correlation is itself informative — it strongly suggests a spurious or third-factor-driven relationship.
Actionable Insights and Further Investigation
Given that only 18.3% of variance is explained and no temporal predictability exists, practitioners should avoid treating this correlation as a trading signal or forecasting tool in isolation. However, several avenues merit deeper investigation. First, segmenting the data by market volatility regimes (e.g., using VIX levels) could reveal whether the correlation is concentrated in high-stress periods — particularly the Q4 2014 oil shock. Second, multivariate modeling incorporating oil prices, Fed communication events, and equity volatility would help isolate whether the volume-inflation link is genuine or entirely mediated by third factors. Third, extending the analysis beyond 2014 to test whether this correlation persists across multiple years would assess robustness. Finally, examining whether specific exchange venues (Cboe vs. TRFs) within the volume data drive the relationship disproportionately could yield insights into whether institutional versus retail trading behavior has differential relationships with inflation expectations.
X dataset: Cboe U.S. Equities Historical Market Volume Data 2014
Y dataset: FRED – 5-Year Breakeven Inflation Rate
Part of experiment: Daily - Cboe U.S. Equities Historical Market Volume Data 2014 vs FRED – 5-Year Breakeven Inflation Rate