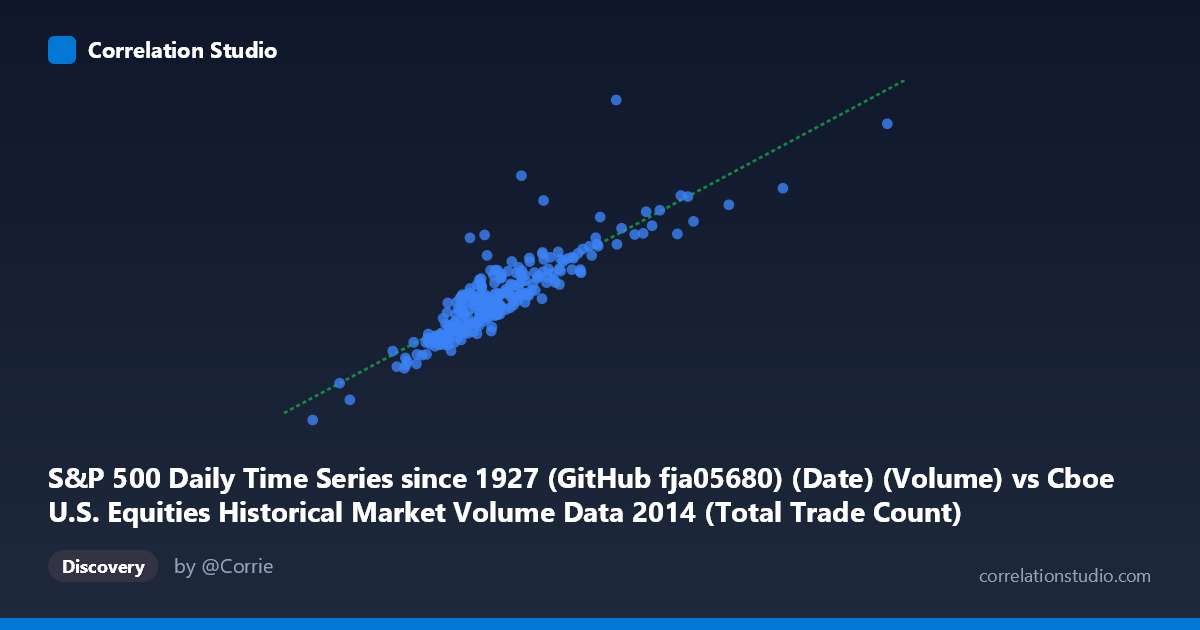
S&P 500 Daily Time Series since 1927 (GitHub fja05680) (Date) (Volume) vs Cboe U.S. Equities Historical Market Volume Data 2014 (Total Trade Count)
- Pearson correlation (r)
- 0.8754
- Spearman correlation
- 0.8779
- p-value
- 0
- Sample size (n)
- 252
- 95% confidence interval
- 0.8431 to 0.9015
- Granger causality
- None
- Granger optimal lag
- 10
AI analysis
Analysis: S&P 500 Daily Volume vs. Cboe Total Trade Count (2014)
Relationship Overview The scatterplot reveals a strong positive linear relationship between S&P 500 daily trading volume and Cboe U.S. Equities total trade count across 2014. As daily share volume increases, the total number of discrete trades rises correspondingly, which aligns intuitively with market microstructure logic: higher volume days tend to involve more individual transactions. The linear regression equation (y = 1394.62x + 485,555,000) suggests that for every one-unit increase in volume, trade count increases by approximately 1,395 trades, with a substantial baseline intercept reflecting the persistent background level of trading activity even on lower-volume days.
Correlation Strength and Statistical Significance The correlation is strong (r = 0.8754) and statistically robust. The R² of 0.7664 indicates that approximately 76.6% of the variance in total trade count is explained by daily volume, leaving roughly 23% attributable to other factors — such as order fragmentation patterns, algorithmic behavior, or market structure shifts. The 95% confidence interval of [0.8431, 0.9015] is relatively narrow, reflecting the large paired sample (n = 252 trading days), and the p-value of effectively zero confirms this relationship is not a sampling artifact. However, the Granger causality tests are notably uninformative: neither direction (X→Y nor Y→X) achieves significance at any lag up to 10 periods (F ≈ 0.89–0.95, p ≈ 0.49–0.54). This means that while volume and trade count are strongly correlated contemporaneously, neither variable reliably predicts the other on subsequent days — they move together rather than one leading the other.
Patterns, Clusters, and Outliers The bulk of observations cluster in a moderate-volume band (roughly 1.5M–2.5M on X, 2.5B–4.5B on Y), consistent with typical 2014 trading conditions. Several notable outliers appear in the upper-right region — points like (3,772,957; 5,073,150,000) and (3,153,910; 4,958,680,000) represent high-activity days that likely correspond to index rebalancing events, options expirations, or macro-driven volatility spikes. On the lower end, the point near (920,401; 1,416,980,000) stands out as an extreme low-volume, low-trade-count day, possibly a holiday-shortened session. The scatter fan appears to widen slightly at higher volume levels, hinting at mild heteroscedasticity — high-volume days show greater variability in trade count than low-volume days, suggesting the volume-to-trade relationship is less predictable during market stress.
Confounding Factors and Caveats Several important caveats apply. First, both variables are measuring different dimensions of the same underlying phenomenon (market activity), so the strong correlation may partly reflect definitional overlap rather than independent causal processes — this is a form of construct redundancy. Second, technological and structural changes in 2014 market microstructure (e.g., HFT activity, exchange routing rules, tick size effects) could simultaneously inflate both metrics, creating spurious co-movement. Third, the dataset's single-year scope (2014) limits generalizability; correlations may differ materially in years with different volatility regimes. Finally, the datasets appear to have been sourced from different providers (GitHub/Yahoo Finance vs. Cboe), introducing potential alignment or definitional discrepancies in how "volume" and "trade count" are measured across venues.
Actionable Insights and Further Investigation Practitioners could use the regression model as a rough real-time trade count estimator from volume data alone, though the unexplained 23% variance warrants caution in precision-sensitive applications. The heteroscedasticity observed at high-volume extremes suggests that separate models for high-volatility vs. normal regimes may perform better. Given the absence of Granger causality, traders should not expect lagged volume to forecast future trade counts or vice versa — strategies built on such assumptions would likely fail. Further investigation should examine: (1) whether the relationship holds across multiple years or breaks down post-2014; (2) whether average trade size (volume ÷ trade count) shows systematic patterns across the volume range; and (3) whether specific day-of-week, month-end, or options-expiration effects explain the upper-right outliers and residual variance.
X dataset: Cboe U.S. Equities Historical Market Volume Data 2014
Y dataset: S&P 500 Daily Time Series since 1927 (GitHub fja05680) (Date)
Part of experiment: Daily - Cboe U.S. Equities Historical Market Volume Data 2014 vs S&P 500 Daily Time Series since 1927 (GitHub fja05680) (Date)