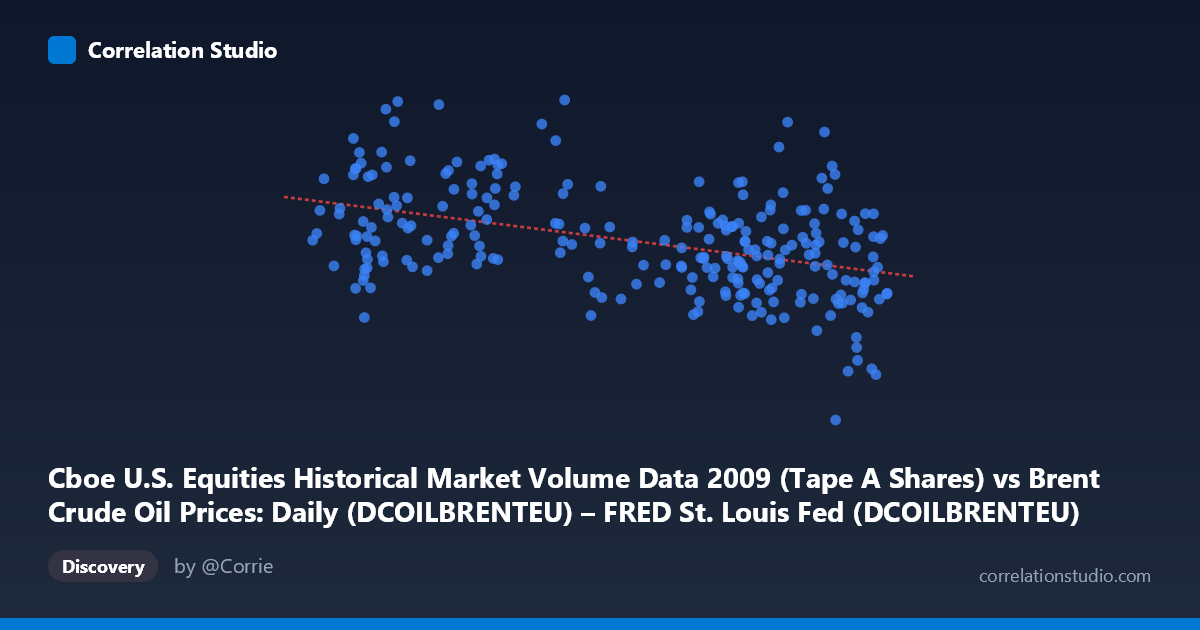
Cboe U.S. Equities Historical Market Volume Data 2009 (Tape A Shares) vs Brent Crude Oil Prices: Daily (DCOILBRENTEU) – FRED St. Louis Fed (DCOILBRENTEU)
- Pearson correlation (r)
- -0.4352
- Spearman correlation
- -0.4117
- p-value
- 0
- Sample size (n)
- 252
- 95% confidence interval
- -0.5303 to -0.3294
- Granger causality
- None
- Granger optimal lag
- 10
AI analysis
Analysis: Brent Crude Oil Prices vs. U.S. Equity Market Volume (2009)
Relationship Overview The scatterplot reveals a moderate negative relationship between daily Brent crude oil prices (X-axis, USD/barrel) and U.S. equity market volume on Tape A (Y-axis, shares traded). As crude oil prices rise, equity trading volume tends to decline, and vice versa. The linear regression equation (y = -3,450,900x + 652,187,000) quantifies this inverse slope: each additional dollar per barrel in crude price is associated with approximately 3.45 million fewer shares traded. Visually, the cloud of points slopes downward from left to right, though with considerable scatter throughout, suggesting the relationship is real but far from deterministic.
Correlation Strength and Statistical Significance The Pearson correlation of r = -0.4352 indicates a moderate negative association. However, the explained variance tells a more sobering story: R² = 0.1894, meaning crude oil prices account for only about 19% of the variance in equity trading volume — leaving roughly 81% unexplained by this single variable. The 95% confidence interval of [-0.5303, -0.3294] is entirely negative, confirming the direction is robust, and the p-value of 4.53 × 10⁻¹³ is extraordinarily small given n = 252, making it statistically implausible that this correlation arose by chance. That said, statistical significance here is partly a function of the large underlying population (N = 3,232), so practical significance should be weighted against the modest R². Critically, the Granger causality tests show no significant predictive directionality in either direction (X→Y: F = 0.96, p = 0.478; Y→X: F = 1.77, p = 0.067), meaning that knowing past crude prices does not reliably predict future equity volume at the tested lag of 10 periods, and vice versa. The correlation is contemporaneous rather than predictive.
Notable Patterns, Clusters, and Outliers Several features stand out in the point cloud. The data clusters most densely in the mid-range of both variables (roughly 55–75 USD/barrel and 350M–600M shares), consistent with the 2009 post-crisis stabilization period. However, there are notable outliers: the point near (75.15, 105,713,299) represents an anomalously low-volume day at a relatively high oil price, while the point near (56.63, 704,192,148) shows exceptionally high volume at a mid-range oil price. These extreme values likely correspond to specific market events — perhaps holiday-shortened sessions or extraordinary news-driven trading days — and exert disproportionate influence on the regression line. Additionally, there appears to be greater variance in volume at lower oil prices (roughly 40–55 USD range), suggesting possible heteroscedasticity where the relationship becomes noisier as oil prices fall, which was characteristic of the volatile early-2009 recovery environment.
Confounding Factors and Interpretive Caveats This correlation almost certainly reflects shared macroeconomic dynamics rather than a direct causal mechanism. The year 2009 spans one of the most volatile market periods in modern history — the tail of the Global Financial Crisis and subsequent recovery. Early 2009 featured extreme market stress, high trading volumes driven by panic selling and volatility, and historically low oil prices. As confidence gradually returned through mid-to-late 2009, oil prices recovered toward $75–80/barrel while market volumes normalized downward. This creates a spurious correlation mediated by the crisis recovery timeline — both variables were responding to the same underlying macroeconomic shock rather than influencing each other. Additionally, equity volume includes algorithmic and high-frequency trading activity, seasonal patterns (note likely holiday-period outliers), and OPEC production decisions affecting oil prices — all independent drivers that cloud any direct interpretation.
Actionable Insights and Further Investigation Given the modest explanatory power and absent Granger causality, practitioners should not use crude oil prices as a standalone predictor of equity volume. However, the relationship warrants deeper investigation through several avenues: (1) Segment the data by month to test whether the negative correlation is driven primarily by the Q1 2009 crisis period versus the later recovery, which would confirm the spurious-correlation hypothesis; (2) Introduce control variables such as the VIX volatility index or S&P 500 returns to partial out the crisis-recovery effect and isolate any residual crude-volume relationship; (3) Test non-linear specifications (e.g., quadratic or regime-switching models) given the visual heteroscedasticity at low price levels; and (4) Replicate across multiple years to determine whether this negative correlation persists outside the anomalous 2009 environment or is purely crisis-specific. The strong p-value is a starting point for inquiry, not a conclusion about practical utility.
X dataset: Brent Crude Oil Prices: Daily (DCOILBRENTEU) – FRED St. Louis Fed
Y dataset: Cboe U.S. Equities Historical Market Volume Data 2009
Part of experiment: Daily - Brent Crude Oil Prices: Daily (DCOILBRENTEU) – FRED St. Louis Fed vs Cboe U.S. Equities Historical Market Volume Data 2009