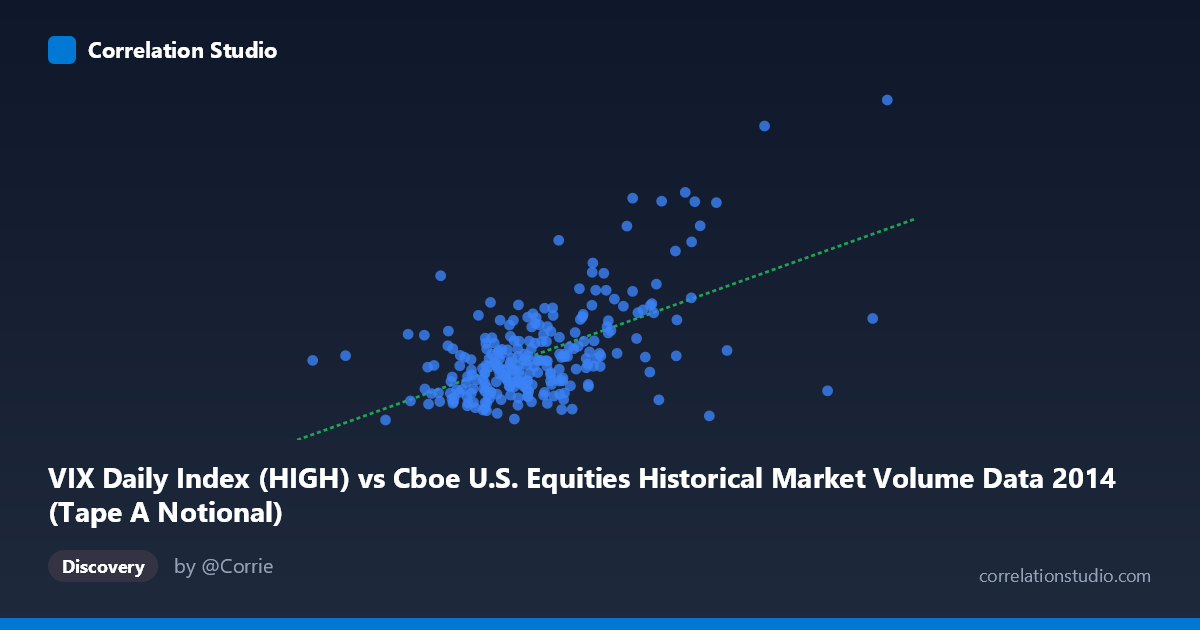
VIX Daily Index (HIGH) vs Cboe U.S. Equities Historical Market Volume Data 2014 (Tape A Notional)
- Pearson correlation (r)
- 0.575
- Spearman correlation
- 0.477
- p-value
- 0
- Sample size (n)
- 252
- 95% confidence interval
- 0.486 to 0.6522
- Granger causality
- None
- Granger optimal lag
- 1
AI analysis
Scatterplot Analysis: VIX Daily Index (HIGH) vs. Tape A Notional Volume (2014)
Overall Relationship
The scatterplot reveals a moderate positive relationship between the VIX Daily Index High values and Tape A Notional trading volume across U.S. equity exchanges in 2014. As VIX High readings increase, Tape A Notional volume tends to rise as well, consistent with the well-established market intuition that elevated volatility environments attract greater trading activity. The linear regression equation (y = 1.03×10⁻⁹x + 6.12) confirms this upward trend, though the scatter around the regression line is considerable, suggesting the relationship is real but far from deterministic. The data spans the full calendar year 2014, capturing a range of market regimes from relatively calm periods to episodic volatility spikes.
Correlation Strength and Statistical Significance
The Pearson correlation of r = 0.575 indicates a moderate positive association, but the explanatory power deserves careful framing: r² = 0.331 means only 33.1% of the variance in Tape A Notional volume is explained by VIX High levels, leaving roughly two-thirds of volume variability attributable to other factors. The 95% confidence interval for r of [0.486, 0.652] is reassuringly narrow given the sample size of 252 paired observations drawn from a population of 3,686 records, and the p-value of effectively zero confirms the correlation is highly unlikely to be a sampling artifact. However, the Granger causality results are notably non-significant in both directions — X→Y (F = 1.58, p = 0.210) and Y→X (F = 0.24, p = 0.623) — meaning that neither variable reliably predicts the future values of the other at a one-period lag. This is a critical nuance: the variables are contemporaneously correlated, but neither leads the other in a temporally predictive sense, cautioning against any simple causal narrative.
Notable Patterns, Clusters, and Outliers
Several structural features are visible in the data. The bulk of observations cluster in the lower-left region of the plot, with VIX High values concentrated roughly between 7–11 billion and Notional volumes between 11–18, reflecting the predominantly low-volatility, moderate-volume environment that characterized much of 2014. However, there are several prominent high-leverage outliers in the upper-right quadrant — notably the point near (13.6B, 29.4) and another near (11.8B, 25.2) — which appear to correspond to specific volatility events (likely the October 2014 market selloff, when VIX spiked sharply). These extreme observations exert disproportionate influence on the regression line and correlation coefficient. There is also a suggestion of non-linearity: the relationship appears relatively flat at lower VIX levels and steepens considerably at high VIX readings, hinting at a possible threshold or regime-switching dynamic rather than a clean linear relationship. The point at approximately (12.3B, 11.0) stands as an interesting counter-outlier — high VIX but anomalously low notional volume — suggesting that high volatility does not invariably translate to high volume.
Confounding Factors and Caveats
Several important caveats apply. First, daily equity volume is driven by a complex ecosystem of factors — earnings seasons, macroeconomic data releases, Federal Reserve communications, index rebalancing, and end-of-quarter flows — none of which are captured here. Second, the axis assignment appears inverted from typical convention: VIX is plotted on the X-axis as drawn from the market volume dataset, and Tape A Notional is sourced from the VIX dataset, which may reflect a data-joining artifact worth verifying before drawing conclusions. Third, Tape A Notional volume specifically covers NYSE-listed securities, meaning it is a subset of total market activity; the correlation might differ for Tape B or Tape C securities. Fourth, the presence of highly influential outlier observations (the October volatility spike) means the correlation estimate may not generalize well to normal market conditions — running the analysis with and without these extreme points would be informative. Finally, both series may be jointly driven by common macro shocks rather than sharing a direct relationship, making the Granger non-causality finding all the more important to heed.
Actionable Insights and Further Investigation
Practitioners and researchers should consider several follow-up steps. The apparent non-linearity warrants fitting a polynomial or piecewise regression, or even a log-log specification, to better capture the accelerating relationship at high VIX levels. Given the Granger non-causality finding, any trading or risk model that assumes VIX predicts next-day volume (or vice versa) should be treated skeptically; intraday data at finer granularity might reveal shorter-lag predictive dynamics not visible at daily resolution. It would be valuable to decompose the analysis by market regime — separating the low-VIX periods (VIX < 15) from the high-VIX episodes — to test whether the correlation is primarily driven by the outlier cluster. Additionally, controlling for day-of-week effects, options expiration dates, and macroeconomic announcement days could sharpen the underlying signal. Finally, extending this analysis to multiple years would reveal whether the 2014 relationship is stable or specific to that year's unique market structure.
X dataset: Cboe U.S. Equities Historical Market Volume Data 2014
Y dataset: VIX Daily Index
Part of experiment: Daily - Cboe U.S. Equities Historical Market Volume Data 2014 vs VIX Daily Index