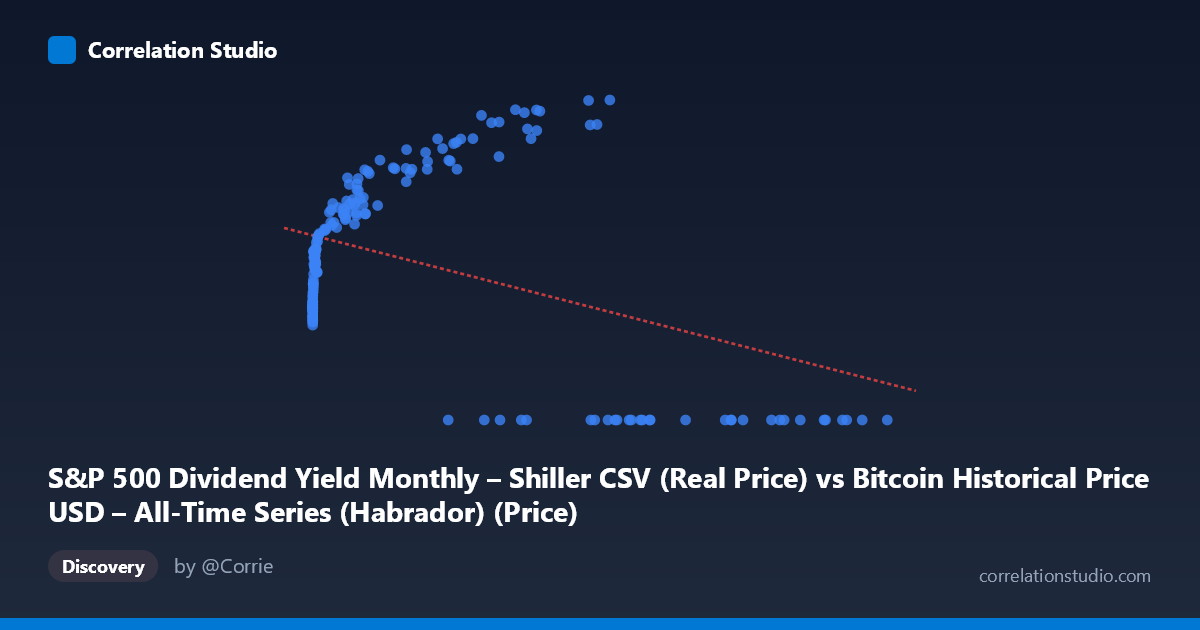
S&P 500 Dividend Yield Monthly – Shiller CSV (Real Price) vs Bitcoin Historical Price USD – All-Time Series (Habrador) (Price)
- Pearson correlation (r)
- -0.4161
- Spearman correlation
- 0.1073
- p-value
- 0
- Sample size (n)
- 189
- 95% confidence interval
- -0.5275 to -0.2906
- Granger causality
- None
- Granger optimal lag
- 10
- Time coverage
- 2010-08-01 to 2026-04-01
- Recomputed on refreshed data
- 2026-10-13 (r was -0.4161)
AI analysis
Analysis: Bitcoin Price vs. S&P 500 Dividend Yield (Cross-Dataset Comparison)
1. What the Visualization Reveals
The scatterplot displays a curious and somewhat problematic pairing: Bitcoin's historical USD price (mislabeled/swapped as X here) against what appears to be S&P 500 dividend yield data, though the Y-axis values (ranging 0–5140) look far too large to be a dividend yield percentage — they more closely resemble a price series. This suggests the axis labels may be reversed or mismatched in the dataset alignment, which is an important caveat before drawing conclusions. Visually, the data shows a curved, non-linear pattern: low X-values cluster tightly around Y≈1600–2000, then Y rises steadily as X increases into the thousands, peaks around Y≈5000 near X≈40,000–60,000, and then collapses to Y=0 for X values above ~60,000–100,000+.
2. Strength, Direction, and Statistical Confidence
The linear correlation is r = -0.416 (r² = 0.173), indicating a moderate negative relationship, but one that only explains about 17% of the variance in Y — meaning linear correlation alone is a weak predictive tool here. The 95% CI [-0.528, -0.291] excludes zero and the p-value (2.6E-09) is highly significant, confirming the negative trend is statistically real and not due to chance, despite the modest effect size. However, the Granger causality tests show no significant predictive direction in either direction (X→Y: p=0.167; Y→X: p=0.065, only marginally suggestive), meaning neither series reliably forecasts the other over time using past values — this undermines any causal or lead-lag trading narrative.
3. Notable Patterns and Outliers
The most striking feature is the sharp discontinuity: many high-X rows (e.g., X 60,000) have Y flatlined at exactly 0.00, which looks like missing/null data rather than a genuine economic zero — this is likely driving much of the apparent "negative correlation" artificially. Separately, the mid-range data (X between ~300 and 50,000) shows a clear positive, curved (logarithmic-like) relationship with Y rising from ~1600 to ~5000, which contradicts the overall negative linear fit. This strongly suggests the relationship is non-linear and the negative slope is an artifact of the zero-value outliers rather than a true inverse relationship.
4. Confounding Factors and Caveats
Several red flags suggest this correlation may not be economically meaningful: (1) the axis/column labels appear swapped or mismatched between the two datasets, making interpretation of "which variable is which" unreliable; (2) the Y=0 entries for large X values are almost certainly data alignment errors, missing records, or padding rather than real observations; (3) pairing a monthly Shiller equity dataset with a full Bitcoin price history (spanning 2010–2026) introduces massive time-scale and frequency mismatches, and Bitcoin's exponential price growth means simple linear correlation is inappropriate; (4) N=1,865 population vs n=189 sample indicates heavy downsampling, and Bitcoin's extreme right-skewed distribution (mean 20,533, stdev 29,894) will disproportionately influence any linear fit.
5. Recommendations for Further Investigation
Before drawing conclusions, verify and correct the data merge/alignment (check for label swaps and confirm the zero-Y values are genuine vs. missing-data placeholders — likely excluding or imputing these). Given the visible non-linear, saturating/curved shape in the valid data range, refit using a log-transform on X (Bitcoin price) or a non-linear/spline model rather than simple linear regression. Finally, since Granger tests show no reliable temporal lead-lag relationship, this pairing should be treated as a spurious or coincidental statistical correlation rather than evidence of a genuine economic relationship between Bitcoin price and equity dividend yield.
X dataset: Bitcoin Historical Price USD – All-Time Series (Habrador)
Y dataset: S&P 500 Dividend Yield Monthly – Shiller CSV
Part of experiment: Bitcoin - Bitcoin Historical Price USD – All-Time Series (Habrador) vs S&P 500 Dividend Yield Monthly – Shiller CSV