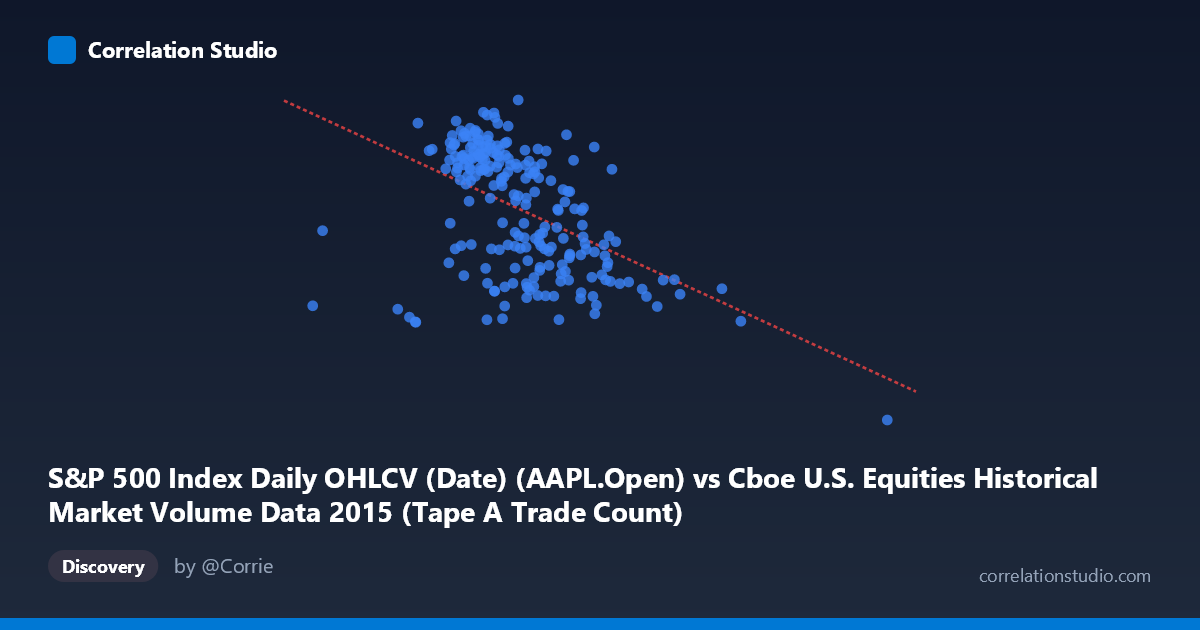
S&P 500 Index Daily OHLCV (Date) (AAPL.Open) vs Cboe U.S. Equities Historical Market Volume Data 2015 (Tape A Trade Count)
- Pearson correlation (r)
- -0.4839
- Spearman correlation
- -0.5042
- p-value
- 0
- Sample size (n)
- 222
- 95% confidence interval
- -0.5787 to -0.3762
- Granger causality
- None
- Granger optimal lag
- 1
AI analysis
Analysis: AAPL Opening Price vs. Cboe Tape A Trade Count (2015)
Relationship Overview The scatterplot reveals a moderate negative relationship between Apple's opening stock price (X-axis) and the Cboe U.S. Equities Tape A trade count (Y-axis) across 2015. As AAPL's opening price increases, the number of Tape A trades tends to decrease. The linear regression equation (y = -1.3944E-05x + 140.784) quantifies this inverse trend, suggesting that for every unit increase in AAPL's opening price, the Tape A trade count declines marginally. Visually, the bulk of data points cluster in the X range of roughly 1,100,000–1,700,000, with Y values concentrated between approximately 110 and 132, while a long right tail of higher X values shows consistently lower Y values.
Correlation Strength and Statistical Significance The Pearson correlation of r = -0.4839 indicates a moderate negative association, but the explained variance tells a more sobering story: r² = 0.2342 means only ~23.4% of the variance in Tape A trade counts is explained by AAPL's opening price, leaving over 76% attributable to other factors. The 95% confidence interval of [-0.5787, -0.3762] is entirely negative, confirming the direction is reliable, and the p-value of 1.954E-14 establishes that this correlation is highly statistically significant — almost certainly not a chance finding given n = 222. However, statistical significance should not be conflated with practical or causal significance. Critically, the Granger causality tests show no significant predictive directionality in either direction (X→Y: F = 0.3387, p = 0.5612; Y→X: F = 0.0545, p = 0.8157), meaning neither variable temporally predicts the other at a one-period lag. This strongly suggests the correlation reflects a shared underlying driver rather than any direct causal mechanism.
Notable Patterns, Clusters, and Outliers Several features stand out. The data forms a dense core cluster around X ≈ 1,200,000–1,500,000 and Y ≈ 115–130, representing typical mid-2015 trading conditions. There is a visible rightward outlier at approximately (2,923,236, 94.87) — an extreme X value paired with the dataset's lowest Y value — which likely corresponds to a high-volume trading day (possibly during the August 2015 market volatility) and may disproportionately influence the regression slope. A secondary concentration appears around X ≈ 1,600,000–1,750,000 with Y values dropping into the 109–116 range, suggesting a regime shift later in the year. The point at (1,415,480, 134.46) represents the highest Y value and sits within the core cluster, appearing somewhat anomalous against the general trend.
Confounding Factors and Caveats The most significant interpretive caveat is that this correlation likely reflects shared temporal dependence rather than a direct relationship. Both AAPL's price and overall market trade counts are driven by broad market conditions — volatility events, macroeconomic releases, Federal Reserve announcements, and seasonal trading patterns in 2015 (including the August correction). AAPL's price decline in late 2015 coincided with periods of elevated market-wide trading activity, making the negative correlation largely a spurious co-movement artifact of the same market environment. Additionally, the dataset labels appear to have an axis mismatch (the X dataset references S&P 500 OHLCV but contains AAPL.Open values), which warrants verification before drawing firm conclusions. The non-random sampling (every 4th point, n = 222 from N = 506) could also introduce bias if any cyclical patterns exist at that frequency.
Actionable Insights and Further Investigation Given the lack of Granger causality, AAPL's opening price should not be used as a leading indicator for Tape A trade volume, nor vice versa, in any predictive model. To better understand what drives Tape A trade counts, investigators should incorporate VIX (volatility index), broader S&P 500 price movement, and macroeconomic event flags as covariates. A time-series decomposition separating trend, seasonality, and residual components for both variables would help clarify whether the correlation is driven by shared long-term trends or genuine cross-variable dynamics. It would also be valuable to test whether the relationship strengthens during high-volatility sub-periods (e.g., August–September 2015), which could reveal conditional or regime-dependent correlations more actionable for trading strategy or market microstructure research.
X dataset: Cboe U.S. Equities Historical Market Volume Data 2015
Y dataset: S&P 500 Index Daily OHLCV (Date)
Part of experiment: Daily - Cboe U.S. Equities Historical Market Volume Data 2015 vs S&P 500 Index Daily OHLCV (Date)