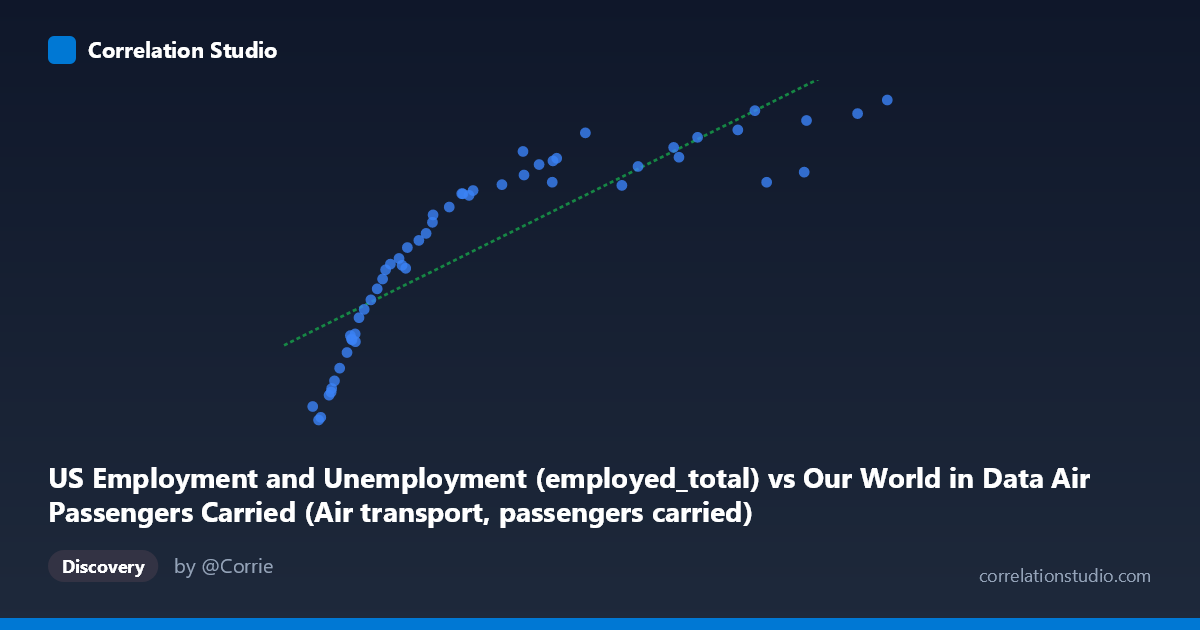
US Employment and Unemployment (employed_total) vs Our World in Data Air Passengers Carried (Air transport, passengers carried)
- Pearson correlation (r)
- 0.8536
- Spearman correlation
- 0.9756
- p-value
- 0
- Sample size (n)
- 54
- 95% confidence interval
- 0.7594 to 0.9127
- Granger causality
- None
- Granger optimal lag
- 10
- Time coverage
- 1970-01-01 to 2023-01-01
AI analysis
Analysis of US Air Passengers Carried vs. US Total Employment (1970–2023)
1. What the Visualization Reveals
The scatterplot displays a clear positive relationship between total US employment and air transport passengers carried over a 53-year period. As employment rises from roughly 8 million to 134 million (X-axis), air passengers carried increases from approximately 78,000 to 161,000 units (Y-axis). The data points follow a broadly upward trajectory, though with visible compression and curvature at the upper end of the X range, suggesting the relationship is not perfectly linear across the full historical span. The linear regression line (y = 0.000584x + 96,856) captures the central tendency reasonably well, but the spread around the line widens somewhat at middle values, hinting at periods of divergence between employment growth and air travel demand.
2. Correlation Strength, Direction, and Temporal Causality
The Pearson correlation of r = 0.854 indicates a strong positive association, and the R² of 0.729 means that approximately 72.9% of the variance in air passengers carried is statistically explained by total employment levels — a substantial shared variance for two macroeconomic time series. The 95% confidence interval of [0.759, 0.913] is relatively tight and does not approach zero, confirming that the association is robust and not a statistical artifact of small samples. The p-value of 2.22×10⁻¹⁶ is effectively zero, making chance an implausible explanation for the observed pattern. However, the Granger causality tests tell a critically important story: neither direction (X→Y nor Y→X) reaches significance (F = 0.79, p = 0.64 for X→Y; F = 0.88, p = 0.57 for Y→X), meaning that past values of employment do not help predict future air passengers, and vice versa. This firmly rules out a simple temporal predictive relationship and strongly implies that both variables are moving together in response to shared underlying forces rather than one driving the other.
3. Notable Patterns, Clusters, and Non-Linear Features
The note that Spearman ρ exceeds Pearson r is analytically important — it signals that the true underlying relationship is more monotonic than linear, and that a logarithmic or polynomial fit would likely reduce residuals. Visually, the lower-left cluster (employment ~8–25M, passengers ~78,000–115,000) is densely packed and well-fitted by the regression, corresponding to the 1970s–1980s era of early commercial aviation expansion. The middle range (~25–75M employment) shows the most scatter, likely reflecting the deregulation era, Gulf War disruptions, and uneven economic cycles of the 1990s. The upper-right region (~100–134M employment, ~140,000–161,000 passengers) shows a flattening tendency — air passenger growth appears to slow relative to employment gains — which is consistent with aviation market maturation and capacity constraints. A few points in the 85–115M employment range with relatively lower-than-expected passenger counts could correspond to post-9/11 (2001–2003) and the 2008–2009 financial crisis periods, where employment and air travel decoupled sharply.
4. Confounding Factors and Caveats
This correlation almost certainly reflects shared secular trends (both variables grow over time with the US economy) rather than a direct causal mechanism between employment levels and air passenger volumes. Classic spurious correlation driven by a common time trend is the primary concern: GDP growth, population expansion, disposable income increases, and technological change simultaneously drive both employment totals and aviation demand. Fuel prices, airfare deregulation (1978), airline bankruptcies, security events (9/11), and pandemic shocks (2020) introduce structural breaks that distort the relationship in specific periods. The unit mismatch also deserves scrutiny — "passengers carried" may be in thousands or millions depending on the source's scaling, and employment figures spanning 1940-origin BLS data mapped onto 1970–2023 aviation data requires careful vintage alignment. Additionally, with N=86 but only n=54 paired observations, ~37% of potential data points are missing, which could introduce selection bias if missing years are non-random (e.g., concentrated during disruption periods).
5. Actionable Insights and Further Investigation
Given the absence of Granger causality, analysts should resist using employment figures as a leading indicator for air travel forecasting without additional modeling. More productive next steps would include: (1) detrending both series (e.g., using first differences or HP filter) to test whether the correlation survives removal of the shared time trend — this is the critical test of whether the relationship is substantive or spurious; (2) fitting a logarithmic regression (given the Spearman Pearson signal) to better capture the concave relationship visible at high employment values; (3) introducing GDP per capita or real disposable income as a potential mediating variable that may explain both trends simultaneously; (4) segmenting the analysis by era (pre/post deregulation, pre/post 9/11, pre/post COVID) to test whether the correlation is stable or structurally time-varying; and (5) exploring aviation-specific demand drivers (ticket prices, route availability, aircraft capacity) that may provide more direct and causally defensible predictors of passenger volumes than aggregate employment.
X dataset: Our World in Data Air Passengers Carried
Y dataset: US Employment and Unemployment
Part of experiment: Yearly - Our World in Data Air Passengers Carried vs US Employment and Unemployment