Ethereum Historical Price Data (volume_reported_spot_usd_1d) vs CryptoDataDownload – Binance BTC/USDT Daily OHLCV (tradecount)
- Pearson correlation (r)
- 0.5837
- Spearman correlation
- 0.8324
- p-value
- 0
- Sample size (n)
- 3191
- 95% confidence interval
- 0.5603 to 0.6061
- Granger causality
- None
- Granger optimal lag
- 10
AI analysis
Analysis: Ethereum Volume vs. Binance BTC/USDT Trade Count
1. Overview of the Relationship
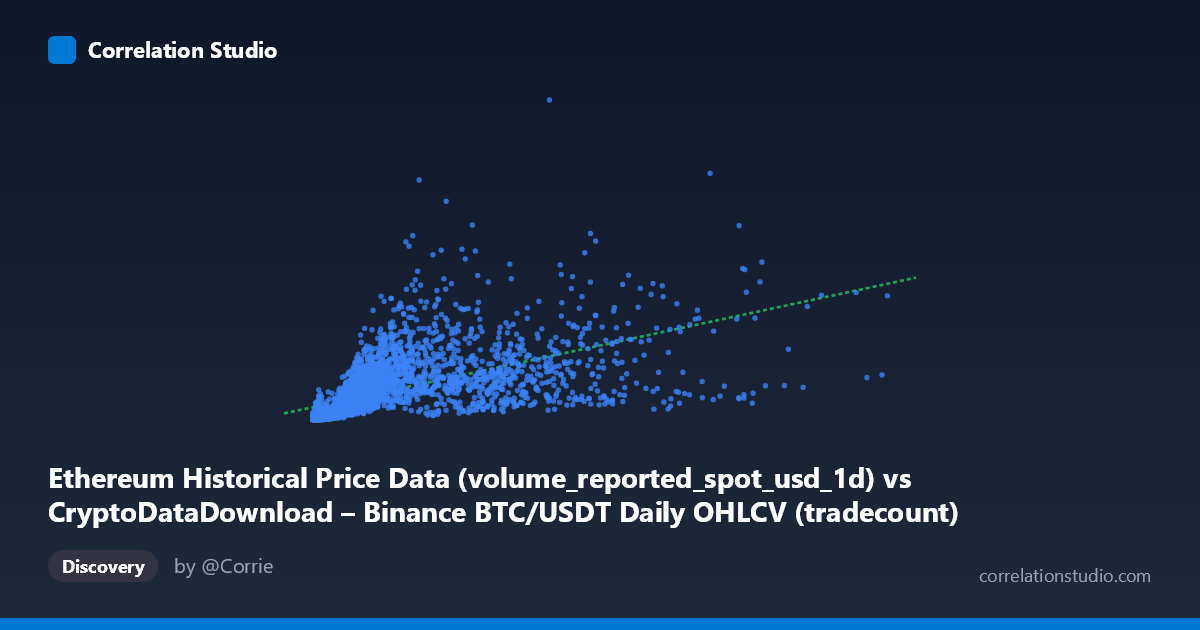
The scatterplot depicts a positive but noisy association between reported Ethereum trading volume (X) and Binance BTC/USDT daily trade count (Y). Both variables span multiple orders of magnitude — X ranges from ~2,153 to over 15.3 million, while Y ranges from ~108 million to nearly 53.7 billion — and the sample points confirm heavy right-skew in both dimensions. Most observations cluster at the lower end of the X range (under 3 million), with a long tail of higher-volume days extending out to the 8–15 million range. This skewness, combined with the mismatch between mean and stdev magnitudes (stdev exceeds mean for both variables), suggests the raw linear correlation coefficient may understate the true monotonic relationship.
2. Strength, Direction, and Statistical Confidence
The Pearson correlation of r = 0.584 indicates a moderate positive linear relationship, with r² = 0.341 meaning only about 34% of the variance in Y is explained by X in a linear framework — leaving roughly two-thirds of the variance driven by other factors or nonlinear dynamics. The 95% CI [0.560, 0.606] is tight given the large sample (n=3,191), and the p-value of ~0 confirms the correlation is highly statistically significant — this is a real, non-random association, not noise. However, statistical significance here reflects sample size more than practical strength; a moderate r with a tight CI still leaves substantial unexplained variance.
Critically, the Granger causality tests show no significant predictive direction in either direction (X→Y: p=0.418; Y→X: p=0.178) at the optimal 10-period lag. This means neither variable reliably precedes or forecasts the other in a time-series sense — the contemporaneous correlation does not translate into temporal lead/lag predictability. Practically, this suggests both series may be driven by a common external factor (e.g., overall crypto market activity/sentiment) rather than one causing the other.
3. Notable Patterns and Non-linear Features
The data shows classic heteroscedastic fanning: at low X values (under 500K), Y ranges widely from ~200 million to over 5 billion, while at higher X values (above 5 million), Y values also vary substantially but with fewer data points to characterize the trend reliably. This is consistent with a power-law or logarithmic relationship rather than a strictly linear one — the note that Spearman ρ exceeds Pearson r reinforces this, indicating the rank-order relationship is stronger than the linear one, a classic signature of monotonic-but-curved data. Several high-leverage points (e.g., X≈8.7M paired with Y≈19B, or X≈4.2M with comparatively modest Y≈5.1B) suggest outliers or regime-dependent behavior, possibly tied to specific high-volatility market events (e.g., 2021 bull run, 2022 crash, 2024–25 cycles) within the 2017–2026 window.
4. Confounding Factors and Caveats
Several caveats apply. First, the labeling is inverted/mismatched in the metadata — X is described as an Ethereum volume column while the dataset name references BTC/USDT OHLCV, and Y is labeled as tradecount from Binance BTC data while attributed to an Ethereum dataset. This suggests a data-merging or column-mapping issue that should be resolved before drawing firm conclusions. Second, both series are time-indexed daily crypto metrics from overlapping/related markets (BTC and ETH), so any correlation is confounded by shared macro drivers: overall market cycles, exchange-wide liquidity, regulatory news, and cross-asset correlation between BTC and ETH (historically very high, often 0.8). Third, the extreme skewness and multi-order-of-magnitude ranges mean a handful of high-volume days can disproportionately influence the linear fit; a log-log transformation would be more appropriate for both visualization and modeling.
5. Actionable Recommendations
1. Verify data lineage — confirm the X/Y column-dataset attribution, as the current labels appear swapped or mismatched. 2. Re-run correlation on log-transformed variables given the note that Spearman Pearson; a log-log or power-law model will likely yield a substantially higher R² and better residual behavior. 3. Segment by market regime (bull/bear/sideways periods) to check if the relationship strength varies across the 2017–2026 span, since crypto market structure changed significantly (e.g., post-2021 institutional adoption, 2022 FTX collapse). 4. Investigate common third factors (e.g., total crypto market cap, BTC price volatility, exchange-wide volume) as potential drivers behind both series, especially given the null Granger causality result. 5. Treat outliers/high-leverage points explicitly — isolate and examine the handful of extreme X or Y values to determine if they represent genuine market events or data artifacts.
X dataset: CryptoDataDownload – Binance BTC/USDT Daily OHLCV
Y dataset: Ethereum Historical Price Data
Part of experiment: Bitcoin - CryptoDataDownload – Binance BTC/USDT Daily OHLCV vs Ethereum Historical Price Data