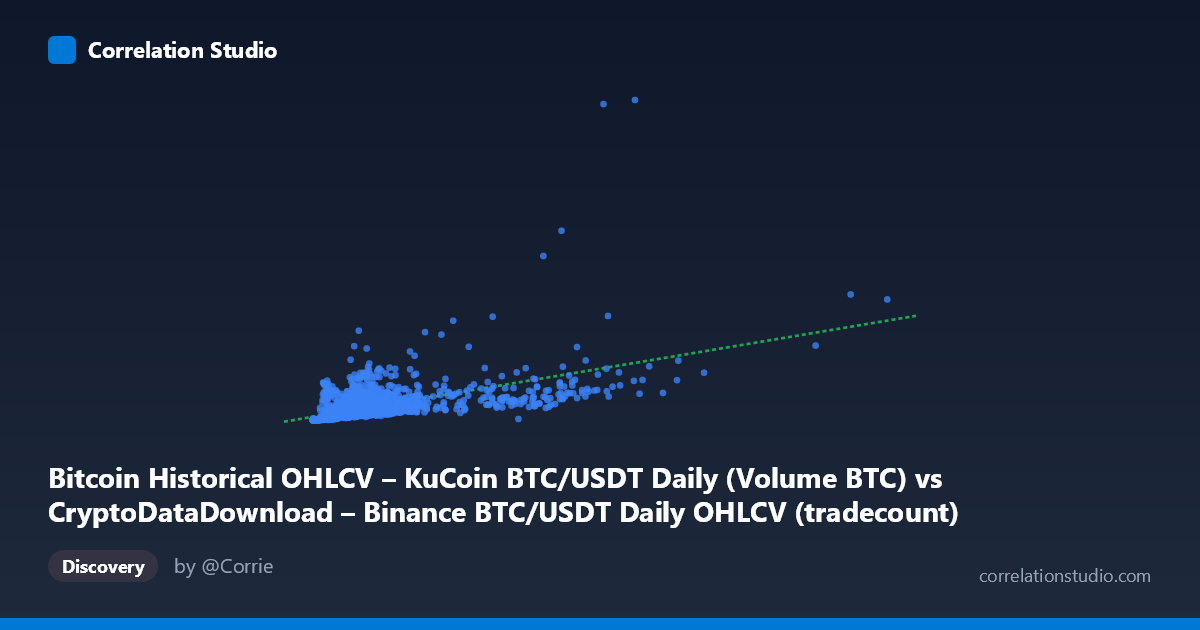
Bitcoin Historical OHLCV – KuCoin BTC/USDT Daily (Volume BTC) vs CryptoDataDownload – Binance BTC/USDT Daily OHLCV (tradecount)
- Pearson correlation (r)
- 0.5878
- Spearman correlation
- 0.8612
- p-value
- 0
- Sample size (n)
- 1861
- 95% confidence interval
- 0.5573 to 0.6168
- Granger causality
- None
- Granger optimal lag
- 10
AI analysis
Analysis: BTC/USDT Trading Volume vs. Trade Count
1. Relationship Overview
The scatterplot examines Bitcoin daily trading volume (X-axis, in BTC) against tradecount (Y-axis, number of trades) across 1,861 daily observations spanning October 2017 to November 2022. Both variables are highly right-skewed — X ranges from ~8,300 to over 14.5 million with a mean far below typical values in the upper range, and Y shows similar skew (mean 4,562 vs. max 130,881). This skewness pattern, combined with the note that Spearman's ρ exceeds Pearson's r, strongly suggests the true relationship is monotonic but non-linear, likely better captured by a log-log or power-law model rather than the fitted linear equation (y = 0.0027x + 1,265).
2. Strength, Direction, and Statistical Confidence
The correlation is moderate-positive (r = 0.588), meaning higher trading volumes tend to co-occur with higher trade counts — an intuitive result, since more activity generally produces both more volume and more individual trades. However, r² = 0.346 indicates only about 35% of the variance in trade count is explained by volume alone, leaving roughly two-thirds of the variability attributable to other factors (e.g., average trade size, market participant behavior, exchange-specific dynamics). The 95% CI [0.557, 0.617] is tight given the large sample size, and the p-value of ~0 confirms the correlation is statistically robust and not due to chance. Critically, the Granger causality tests show no significant predictive direction in either direction (X→Y: p=0.244; Y→X: p=0.595) at the optimal 10-lag specification. This means neither variable reliably forecasts the other over time — the relationship is contemporaneous/structural rather than a lead-lag dynamic, undermining any use of one series to predict future movements in the other.
3. Notable Patterns and Outliers
The sample points reveal a clear non-linear curvature: at low volumes (under ~500,000 BTC), tradecount values are compressed near the bottom (tens to low thousands), but the relationship steepens sharply beyond ~1,000,000 BTC, with several points (e.g., 3,559,270 → 40,616; 5,588,482 → 16,905) showing disproportionately large trade counts relative to a simple linear extrapolation. Conversely, some high-volume points (e.g., 6,443,370 → 11,165; 6,820,580 → 11,025) sit well below what the trend at lower volumes might suggest, indicating heteroscedasticity — variance in Y increases and becomes less predictable as X grows. There's also at least one striking outlier: (292,888 → 8,993.82) has a tradecount far higher than nearby volume values would predict, hinting at a day with unusually small average trade sizes (possibly high-frequency/bot activity or a stablecoin arbitrage event).
4. Confounding Factors and Caveats
Several confounders likely dilute the linear relationship. First, average trade size varies over time — institutional block trades inflate volume without proportionally increasing trade count, while retail-driven periods (e.g., 2021 bull market, meme-coin-adjacent activity) may show many small trades inflating tradecount relative to volume. Second, both series are non-stationary over a 5-year span covering vastly different market regimes (2017 mania, 2018–19 bear market, 2020–21 bull run, 2022 crash), so the pooled correlation may be an artifact of shared trending behavior rather than a stable behavioral link — this also explains why Granger causality (which accounts for temporal ordering) finds no consistent lead-lag pattern. Third, cross-referencing a KuCoin-labeled column with Binance-labeled metadata (as the axis descriptions show some mismatch/mislabeling) raises a data provenance concern that should be verified before drawing firm conclusions.
5. Recommendations for Further Investigation
1. Re-fit using log-transformed variables (log(X) vs. log(Y)) to test the power-law hypothesis suggested by the Spearman/Pearson discrepancy — this will likely raise explained variance substantially. 2. Segment by market regime (bull/bear/sideways periods) to check whether the volume-tradecount relationship is stable or regime-dependent. 3. Investigate average trade size (Volume/Tradecount) as a derived variable — its trend over time may explain the residual variance better than either raw series. 4. Verify data source labeling (Binance vs. KuCoin mismatch in the metadata) to ensure the two columns are correctly paired and not accidentally merged from mismatched exchanges/timestamps. 5. Given the null Granger result, avoid using either series as a predictive leading indicator for the other in trading models; instead treat the relationship as descriptive/contemporaneous only.
X dataset: CryptoDataDownload – Binance BTC/USDT Daily OHLCV
Y dataset: Bitcoin Historical OHLCV – KuCoin BTC/USDT Daily
Part of experiment: Bitcoin - CryptoDataDownload – Binance BTC/USDT Daily OHLCV vs Bitcoin Historical OHLCV – KuCoin BTC/USDT Daily