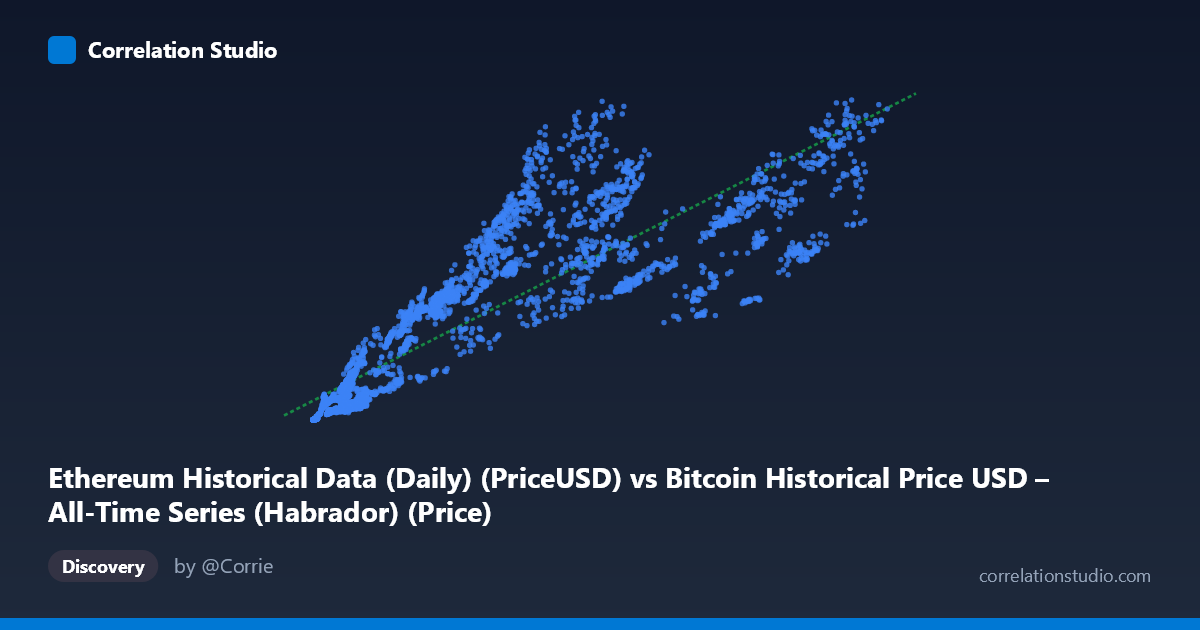
Ethereum Historical Data (Daily) (PriceUSD) vs Bitcoin Historical Price USD – All-Time Series (Habrador) (Price)
- Pearson correlation (r)
- 0.8742
- Spearman correlation
- 0.9456
- p-value
- 0
- Sample size (n)
- 3917
- 95% confidence interval
- 0.8666 to 0.8814
- Granger causality
- None
- Granger optimal lag
- 1
- Time coverage
- 2015-08-08 to 2026-04-28
AI analysis
Analysis: Ethereum vs. Bitcoin Historical Price Relationship
Note on labeling: The axis labels appear swapped relative to the dataset descriptions — the X-axis data (ranging ~$200-$125,000) and its scale/pattern is consistent with Bitcoin price history, while Y-axis values (capped near $4,831) align with historical Ethereum prices. The analysis below treats X as Bitcoin (BTC) and Y as Ethereum (ETH), consistent with the actual value ranges.
1. Relationship Overview The scatterplot reveals a strong, positive, roughly linear relationship between Bitcoin and Ethereum prices over the 2015–2026 sample period. As BTC rises from the hundreds into the tens of thousands of dollars, ETH climbs correspondingly from under $1 to over $4,500. This is expected given that both assets are large-cap cryptocurrencies subject to shared market cycles, but the tightness of the relationship is still notable — the data points cluster fairly closely around the fitted regression line (y = 0.0355x + 281.66) across most of the range, particularly in the low-to-mid BTC price bands.
2. Strength, Direction, and Statistical Confidence The correlation coefficient (r = 0.874) indicates a strong positive linear relationship, with R² = 0.764 meaning 76.4% of the variance in ETH price is statistically explained by BTC price — a substantial but not complete explanatory relationship, leaving ~24% of ETH's price movement driven by factors independent of BTC (e.g., ETH-specific news, DeFi/NFT cycles, network upgrades). The 95% CI [0.867, 0.881] is tight given the large sample (n=3,917), and the p-value of ~0 confirms this correlation is not due to chance. However, the Granger causality tests show no significant predictive direction (BTC→ETH: p=0.642; ETH→BTC: p=0.238) — meaning neither asset's past prices reliably forecast the other's future movements at a 1-period lag. This is a crucial distinction: strong contemporaneous correlation does not imply that one asset leads or causes the other's price changes; they likely move together due to shared external drivers rather than one directly influencing the other.
3. Notable Patterns and Outliers Several features stand out: - Heteroscedasticity: Variance around the regression line increases substantially at higher BTC prices ($60,000), where ETH values scatter more widely (e.g., BTC≈$93,784 paired with ETH=$1,793 vs. BTC≈$115,830 paired with ETH=$4,463) — suggesting the relationship weakens or becomes noisier during high-price regimes, likely different market cycles/eras. - Possible cycle clustering: Points seem to separate into distinct "bands" or cycles (e.g., a 2017-like cycle vs. a 2021/2024-like cycle), where the BTC/ETH ratio shifts between bull runs, consistent with ETH sometimes outperforming or underperforming BTC in specific market phases ("alt-season" effects). - Low-end compression: At low BTC prices (<$1,000), ETH values compress near zero, reflecting ETH's later market entry (2015) and initially negligible valuation.
4. Confounding Factors and Caveats This correlation is almost certainly driven by shared macro confounders rather than a direct causal mechanism: overall crypto market sentiment, Bitcoin dominance cycles, macroeconomic liquidity conditions (interest rates, dollar strength), and correlated retail/institutional capital flows into the asset class as a whole. Time-series data like this also violates independence assumptions underlying standard correlation/regression — both series are non-stationary (trending) and likely autocorrelated, which can artificially inflate r and R² ("spurious correlation" risk despite the low p-value). The lack of Granger causality reinforces that this is likely a common-driver relationship, not a lead-lag causal one.
5. Suggestions for Further Investigation - Detrend/difference the series (e.g., use daily returns instead of price levels) and re-run correlation and Granger tests to check if the relationship holds after removing shared trend/non-stationarity. - Segment by market cycle/era (bull vs. bear, pre/post major ETH upgrades like the Merge) to see if the BTC-ETH relationship strength or slope changes over time. - Test longer Granger lags (multi-day/week) since 1-period lag may be too short to capture cross-asset lead-lag effects. - Add a rolling correlation window to visualize how r changes dynamically rather than assuming a single static relationship across an 11-year span.
X dataset: Bitcoin Historical Price USD – All-Time Series (Habrador)
Y dataset: Ethereum Historical Data (Daily)
Part of experiment: Bitcoin - Bitcoin Historical Price USD – All-Time Series (Habrador) vs Ethereum Historical Data (Daily)