Bitcoin Historical OHLCV – KuCoin BTC/USDT Daily (Volume USDT) vs CryptoDataDownload – Binance BTC/USDT Daily OHLCV (Volume USDT)
- Pearson correlation (r)
- 0.6833
- Spearman correlation
- 0.9046
- p-value
- 0
- Sample size (n)
- 1861
- 95% confidence interval
- 0.6583 to 0.7068
- Granger causality
- None
- Granger optimal lag
- 10
- Time coverage
- 2017-10-19 to 2022-11-29
AI analysis
Analysis: Binance vs. KuCoin BTC/USDT Daily Trading Volume
1. Relationship Overview
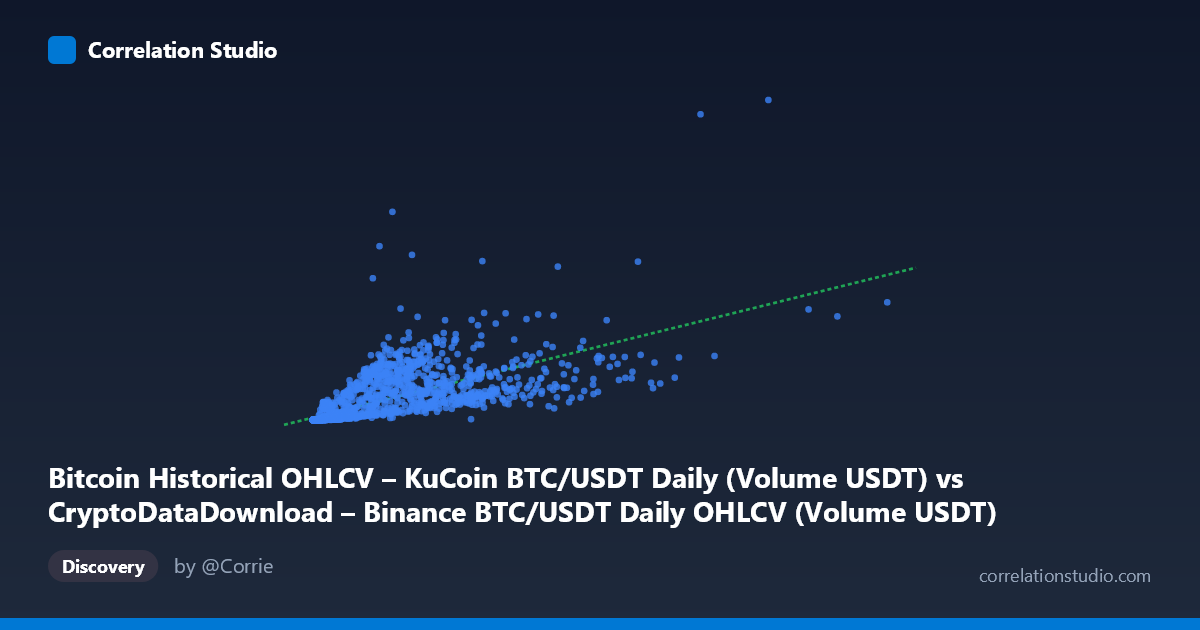
The scatterplot compares daily USDT trading volume for BTC/USDT on two exchanges — Binance (X) and KuCoin (Y) — over roughly five years (Oct 2017–Nov 2022). Both variables represent the same underlying asset and quote currency, so a positive relationship is expected: on days when Bitcoin trading activity surges market-wide (high volatility, news events, liquidations), volume tends to rise on both platforms simultaneously. The data confirms this, but the relationship is far from perfectly proportional — KuCoin volume is consistently a small fraction of Binance volume (regression slope ≈0.078, meaning KuCoin volume is typically ~7.8% of Binance's), and the scatter around that trend is substantial.
2. Strength, Direction, and Predictive Direction
The Pearson correlation (r = 0.683) indicates a moderate-to-strong positive linear relationship, but r² = 0.467 shows that less than half (46.7%) of the variance in KuCoin volume is explained by Binance volume — meaning the majority of day-to-day fluctuation in KuCoin volume is driven by factors independent of Binance's volume level. The 95% CI [0.658, 0.707] is tight, and the p-value is effectively 0, so we can be highly confident this correlation is real and not a sampling artifact — but statistical significance here reflects the large N (1,861), not necessarily strong predictive power. Critically, the Granger causality test found no significant predictive direction in either direction (X→Y: p=0.776; Y→X: p=0.568), even at an optimal lag of 10 days. This means neither exchange's volume reliably leads the other in time — they appear to move together contemporaneously (likely both responding to the same external market shocks) rather than one causing or forecasting the other.
3. Patterns and Outliers
The data shows strong heteroscedasticity: variance in Y increases dramatically as X increases, producing a classic "cone" or fan shape typical of financial volume data. At low Binance volumes (~$50M–500M), KuCoin volume is tightly clustered near zero (often under $10M). At high Binance volumes (multi-billion), KuCoin volume becomes far more dispersed — ranging from ~$150M to over $1.2B for similar X values (e.g., the $6.3B point yields $1.24B on Y, while a nearby $7.2B point yields only $209M). This wide scatter at high volumes, combined with the note that Spearman ρ exceeds Pearson r, suggests the true relationship is better modeled as a power-law, log-log, or multiplicative one rather than linear — consistent with financial volume data, which is typically log-normally distributed and where proportional (percentage) relationships matter more than absolute differences.
4. Confounding Factors and Caveats
Several caveats apply: (a) both series measure the same instrument's activity, so co-movement is structurally expected (shared market conditions like bull/bear regimes, exchange listings, or macro news) rather than causal; (b) volume figures are exchange-specific and affected by wash trading, fee/rebate structures, listing incentives, and reporting practices, which can inflate or distort one exchange's numbers independent of true market activity; (c) the KuCoin data reflects a much smaller, less liquid market, making it more susceptible to idiosyncratic spikes (e.g., specific promotions, referral campaigns, or localized trading activity) unrelated to Binance; (d) linear regression/Pearson correlation is a poor fit given the exponential-scale, skewed nature of the data — using log-transformed volumes would likely yield a cleaner, more interpretable relationship.
5. Recommendations
For more meaningful analysis: (1) log-transform both X and Y before computing correlation/regression, since volume data is heavily right-skewed and multiplicative in nature; (2) test for a market-wide "third factor" (e.g., total crypto market volume, BTC price volatility/ATR, or a volume index across many exchanges) that may better explain both series simultaneously, since neither appears to Granger-cause the other; (3) segment the analysis by market regime (bull vs. bear, high vs. low volatility periods) to see if the relationship strengthens or weakens contextually; (4) investigate specific outlier days (e.g., the $6.3B/$1.24B point) to check for exchange-specific events like liquidation cascades, API/data anomalies, or promotional trading periods that may be distorting the relationship.
X dataset: CryptoDataDownload – Binance BTC/USDT Daily OHLCV
Y dataset: Bitcoin Historical OHLCV – KuCoin BTC/USDT Daily
Part of experiment: Bitcoin - CryptoDataDownload – Binance BTC/USDT Daily OHLCV vs Bitcoin Historical OHLCV – KuCoin BTC/USDT Daily