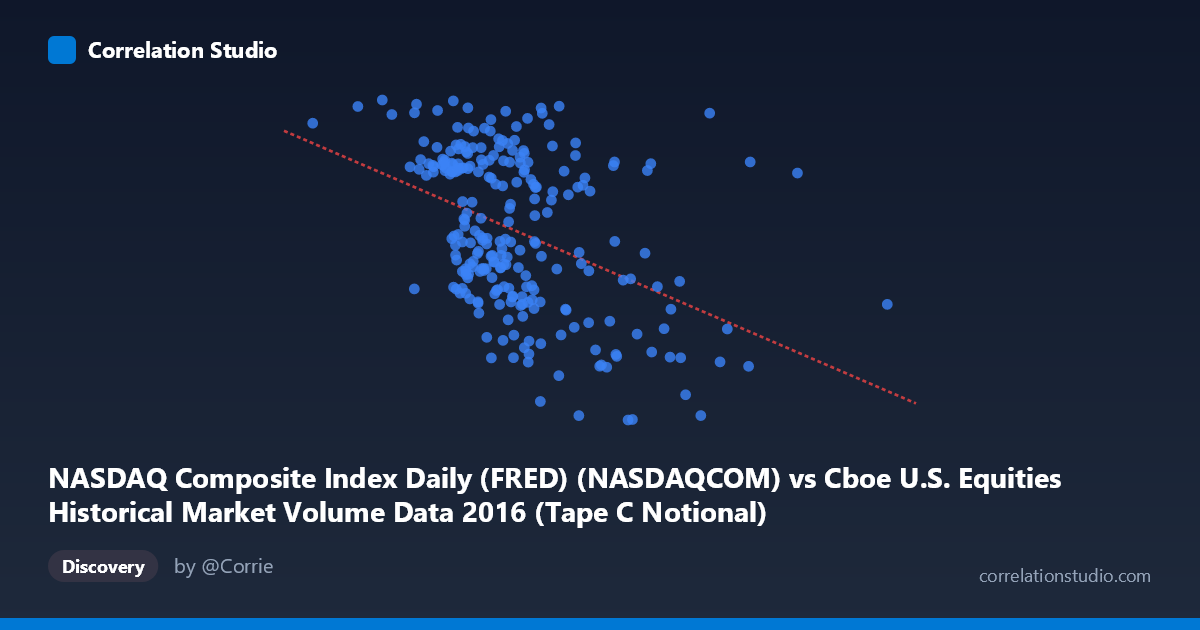
NASDAQ Composite Index Daily (FRED) (NASDAQCOM) vs Cboe U.S. Equities Historical Market Volume Data 2016 (Tape C Notional)
- Pearson correlation (r)
- -0.4166
- Spearman correlation
- -0.42
- p-value
- 0
- Sample size (n)
- 252
- 95% confidence interval
- -0.5137 to -0.3089
- Granger causality
- None
- Granger optimal lag
- 10
AI analysis
Analysis: NASDAQ Composite Index vs. Cboe Tape C Notional Volume (2016)
Relationship Overview The scatterplot reveals a modest negative relationship between the NASDAQ Composite Index level and Cboe Tape C notional trading volume throughout 2016. As the NASDAQ index rose across the year, notional volume on Tape C (which covers NYSE Arca-listed securities) tended to decline. The linear regression equation (y = -1.086×10⁻⁷x + 5528.59) quantifies this inverse slope, suggesting that for every ~9.2-point increase in the NASDAQ index, Tape C notional volume decreases by approximately 1 unit. This pattern is broadly consistent with a well-known market microstructure phenomenon: as equity markets trend higher in a calm, low-volatility environment, aggregate trading volume often contracts because fewer participants feel urgency to rebalance or hedge.
Correlation Strength and Statistical Significance The correlation of r = -0.417 reflects a weak-to-moderate negative association. Critically, the R² of 0.174 means that only about 17.4% of the variance in Tape C notional volume is explained by the NASDAQ index level — the vast majority (82.6%) is driven by other factors entirely. The 95% confidence interval of [-0.514, -0.309] is entirely negative, confirming directional consistency, and the p-value of 5.33×10⁻¹² establishes that this correlation is highly unlikely to be a chance finding given the sample of 252 paired observations drawn from a population of 3,622. However, statistical significance here is partly a function of sample size; the effect itself remains modest. Importantly, Granger causality tests find no significant predictive direction in either direction (X→Y: F=0.315, p=0.977; Y→X: F=0.530, p=0.868), meaning that knowing yesterday's NASDAQ level does not help predict today's notional volume, and vice versa. This is a crucial caveat: the correlation is contemporaneous and associative, not temporally predictive.
Patterns, Clusters, and Outliers Several structural features are visible in the data. The bulk of observations cluster in the NASDAQ range of roughly 3.9–5.5 billion, with notional volume concentrated between 4,700 and 5,400, forming a diffuse but downward-sloping cloud. There are notable high-X outliers — a handful of observations above 6.5 billion (including points near 7.3 billion and 10.6 billion in the full range) that tend to appear at lower Y values, pulling the regression slope and amplifying the negative correlation. These extreme-volume days likely correspond to specific events such as index rebalancing, options expiration, or macro shock days (e.g., the Brexit vote in late June 2016 or the U.S. election in November). The lower-left region shows relatively few observations, suggesting that very low NASDAQ values and very low notional volume did not co-occur frequently in 2016.
Confounding Factors and Caveats Several important confounders complicate interpretation. Time-series autocorrelation is a significant concern — both the NASDAQ index and daily notional volume exhibit strong serial dependence, which can inflate the apparent correlation between two trending or mean-reverting series. The NASDAQ trended upward through much of 2016, while volume may have independently trended in response to volatility regimes, creating a spurious correlation via shared temporal drift. Additionally, Tape C specifically covers NYSE Arca-listed ETFs and stocks, so its notional volume reflects ETF arbitrage activity, sector rotation, and institutional flows that may respond to NASDAQ-level movements through indirect channels. The dataset also spans a single calendar year, limiting generalizability. The absence of Granger causality further reinforces that any observed relationship may be coincidental co-movement rather than a structural economic link.
Actionable Insights and Further Investigation Practitioners should be cautious about using NASDAQ index levels as a predictor of Tape C notional volume in any trading or risk model — the low R² and absent Granger causality make this a poor standalone predictor. Recommended next steps include: (1) incorporating the VIX or realized volatility as a control variable, since volatility is likely a common driver of both series; (2) decomposing the notional volume data by event type (options expiration weeks, FOMC days, index rebalancing dates) to test whether outlier structure explains a disproportionate share of the correlation; (3) extending the analysis to multiple years to test whether the negative relationship is stable or an artifact of 2016's specific market environment; and (4) applying cointegration testing rather than simple correlation to properly handle the non-stationary nature of both time series. The relationship, while statistically real, should be treated as a descriptive stylized fact rather than a causal or predictive mechanism.
X dataset: Cboe U.S. Equities Historical Market Volume Data 2016
Y dataset: NASDAQ Composite Index Daily (FRED)
Part of experiment: Daily - Cboe U.S. Equities Historical Market Volume Data 2016 vs NASDAQ Composite Index Daily (FRED)