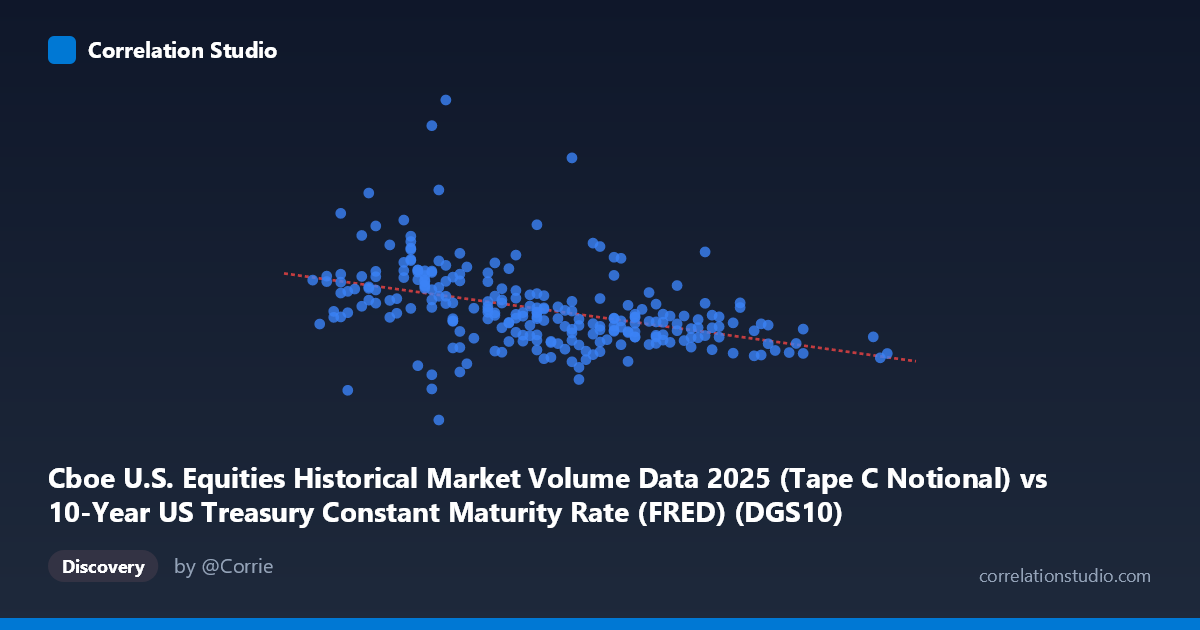
Cboe U.S. Equities Historical Market Volume Data 2025 (Tape C Notional) vs 10-Year US Treasury Constant Maturity Rate (FRED) (DGS10)
- Pearson correlation (r)
- -0.4273
- Spearman correlation
- -0.5317
- p-value
- 0
- Sample size (n)
- 248
- 95% confidence interval
- -0.524 to -0.3197
- Granger causality
- None
- Granger optimal lag
- 10
AI analysis
Scatterplot Analysis: 10-Year Treasury Yield vs. Cboe Equity Market Notional Volume
1. Overall Relationship Pattern
The scatterplot reveals a moderate negative relationship between the 10-year US Treasury constant maturity rate (x-axis) and Cboe U.S. equity market notional trading volume (y-axis) across 2025 trading days. As Treasury yields rise, equity notional volume tends to decline, which aligns with intuitive financial logic — higher rates can dampen equity market activity by increasing the opportunity cost of equities and tightening financial conditions. However, the relationship is far from clean: there is substantial vertical scatter at nearly every x-value, particularly in the 4.10–4.35 yield range where volume observations span from roughly $13.8B to over $32B. This wide dispersion signals that yield alone is a poor standalone predictor of daily trading volume.
2. Correlation Strength, Direction, and Causality
The Pearson correlation of r = -0.4273 indicates a moderate negative association, but the explanatory power is modest at best. The R² of 0.1826 means that only ~18.3% of the variance in equity notional volume is explained by the 10-year yield — leaving over 81% attributable to other factors entirely. The 95% confidence interval of [-0.524, -0.320] is reassuringly narrow and entirely negative, confirming the direction is reliable, and the p-value of 1.99×10⁻¹² makes this statistically unambiguous given n = 248 paired observations from a population of 4,805. That said, statistical significance should not be conflated with practical significance here — an R² below 0.20 in a financial context is a weak predictive foundation. Critically, the Granger causality tests show no significant temporal predictive direction in either direction (X→Y: F = 1.02, p = 0.427; Y→X: F = 0.49, p = 0.894), meaning neither variable reliably predicts the other's future values at the optimal 10-period lag. The correlation appears to be contemporaneous and associative rather than causally directional.
3. Notable Patterns, Clusters, and Outliers
Several features stand out structurally. There is a loose clustering of observations between yields of 4.10–4.35 (roughly centered on the mean of 4.29), which reflects where the yield spent most of its time in 2025 — this cluster also shows the greatest volume variance, reinforcing the noise problem. At the higher yield tail (4.55–4.79), volume observations compress noticeably toward lower values ($15B–$21B), consistent with the negative slope. A few notable outliers are visible: one observation near (4.05, $32.6B) and another near (4.18, $42.7B — the dataset maximum) sit well above the regression line, suggesting episodic spikes in volume that are disconnected from the rate environment (likely event-driven days such as major economic data releases or volatility events). The Spearman ρ exceeding Pearson r further hints that the relationship is not strictly linear — a logarithmic or polynomial fit may better capture the apparent steeper drop-off in volume at extreme yield levels.
4. Confounding Factors and Interpretive Caveats
Several important caveats limit causal interpretation. First, both variables are time-indexed in 2025, meaning common macro drivers — Federal Reserve policy communications, inflation prints, geopolitical events — could be simultaneously moving yields and equity volumes, creating spurious correlation through shared confounders. Second, equity notional volume is mechanically tied to price levels (notional = shares × price), so rising or falling equity prices independent of yield movements will inflate or deflate this metric. Third, the dataset covers only one calendar year (2025), making it difficult to distinguish cyclical patterns from structural relationships. Fourth, the Tape C notional figure represents only a portion of total US equity volume (not all exchanges), which introduces a measurement representativeness concern. Finally, day-of-week effects, option expiration calendars, and index rebalancing events all create volume spikes unrelated to rates.
5. Actionable Insights and Further Investigation
Given the weak explanatory power and absence of Granger causality, practitioners should avoid using 10-year yields alone as a volume forecasting signal. However, the statistically robust negative correlation does suggest yields belong in a multi-factor volume model alongside VIX (as a volatility/risk-appetite proxy), equity index return magnitude, and macro event calendars. Specific next steps worth pursuing include: (1) testing a polynomial or log-linear regression to assess whether the non-linearity flagged by the Spearman/Pearson divergence meaningfully improves fit; (2) segmenting the data by yield regime (e.g., below vs. above 4.30) to test whether the relationship strengthens in high-yield environments; (3) incorporating yield changes (Δyield) rather than levels, as daily volume may respond more to rate surprises than to absolute levels; and (4) extending the time series beyond 2025 to validate whether this relationship is structurally persistent or a 2025-specific phenomenon tied to a particular monetary policy phase.
X dataset: 10-Year US Treasury Constant Maturity Rate (FRED)
Y dataset: Cboe U.S. Equities Historical Market Volume Data 2025
Part of experiment: Daily - 10-Year US Treasury Constant Maturity Rate (FRED) vs Cboe U.S. Equities Historical Market Volume Data 2025