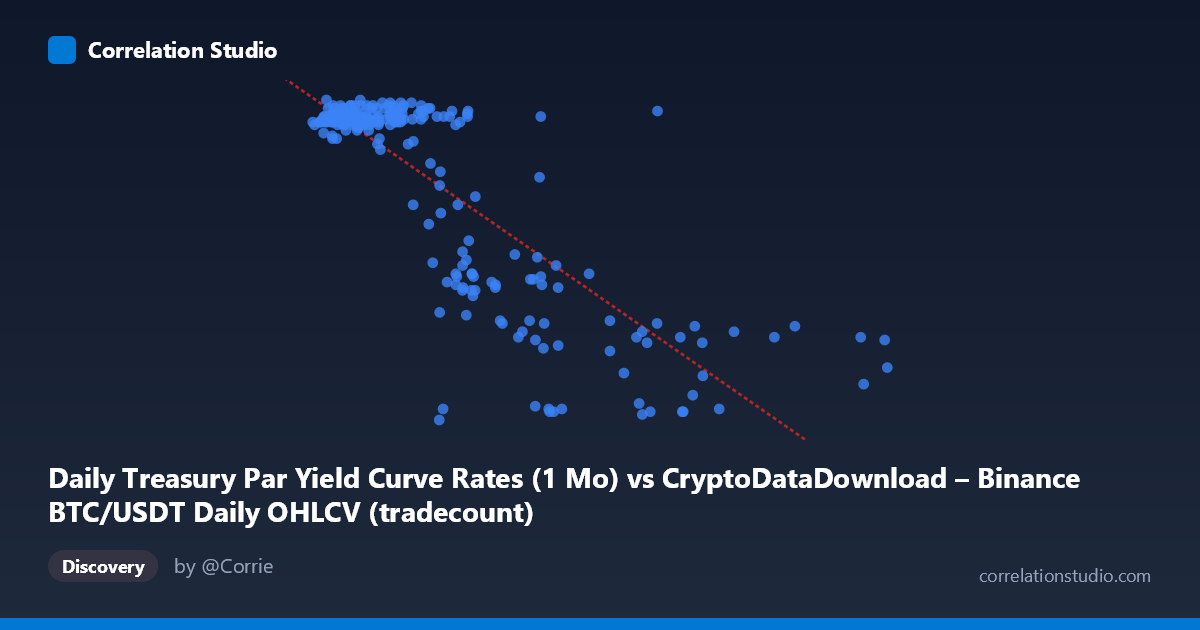
Daily Treasury Par Yield Curve Rates (1 Mo) vs CryptoDataDownload – Binance BTC/USDT Daily OHLCV (tradecount)
- Pearson correlation (r)
- -0.8176
- Spearman correlation
- -0.5584
- p-value
- 0
- Sample size (n)
- 250
- 95% confidence interval
- -0.855 to -0.7719
- Granger causality
- X → Y
- Granger optimal lag
- 1
AI analysis
Analysis of the Relationship Between X and Y Variables
1. Visual Pattern Overview
The scatterplot reveals a clear negative, non-linear relationship between the two variables. As X increases from roughly 900,000 to 12,000,000, Y declines from approximately 5.5 to 4.4. However, the relationship is not uniformly linear — the data shows a distinctive pattern where Y remains tightly clustered near 5.48–5.55 for X values below ~4,000,000, then drops more steeply and with greater dispersion as X exceeds 4,000,000. This suggests a possible threshold or regime-shift effect rather than a constant-rate linear decay.
2. Strength, Direction, and Statistical Confidence
The correlation coefficient (r = -0.8176) indicates a strong negative linear relationship, with R² = 0.6685 meaning approximately 67% of the variance in Y is explained by X — a substantial but not complete explanatory relationship, leaving roughly a third of variance attributable to other factors or noise. The 95% confidence interval [-0.8550, -0.7719] is narrow and entirely negative, and the p-value of 0 (effectively p < 0.001) confirms this correlation is highly statistically significant and not a chance artifact, especially given the robust sample size (n=250). The Granger causality results add a temporal dimension: X Granger-causes Y (F=7.84, p=0.0055) with no significant reverse causality (Y→X, p=0.22), suggesting that past values of X have predictive power for future values of Y, but not vice versa — consistent with treasury yields (X) leading changes in crypto trading activity (Y) rather than the reverse.
3. Notable Patterns and Clusters
Two distinct clusters are visible: a dense, low-variance cluster where X < 4,000,000 and Y sits consistently in the 5.4–5.55 range (representing the majority of low-yield days), and a more scattered, lower-Y cluster where X 4,000,000, with values ranging from 4.4 to 4.9. This bimodal clustering — rather than a smooth linear decay — implies the relationship may be better modeled as two regimes or a non-linear (e.g., logarithmic or step) function. Points like (8,250,511 → 4.49) and (11,556,189 → 4.53) represent the extreme low-Y, high-X tail, while the bulk of low-X points show remarkably little variance, hinting at a floor effect in Y at low interest rates.
4. Confounding Factors and Caveats
A critical caveat is the mismatched labeling in the data description: the X-axis is described as Treasury yield data while Y is described as tradecount, yet the actual values (X in millions, Y bounded 4.4–5.6) suggest the axes may actually be reversed relative to their labels, or units are inconsistent — this should be verified before drawing economic conclusions. Additionally, both series are time-ordered daily data over a single year (2024), meaning autocorrelation, shared macroeconomic drivers (e.g., Fed policy affecting both crypto markets and yields), and non-stationarity could inflate the apparent correlation without implying direct causation. The Granger test only establishes predictive precedence, not true causal mechanism.
5. Suggestions for Further Investigation
Given the apparent regime change around X ≈ 4,000,000, a piecewise or non-linear regression (e.g., segmented regression, log transformation) would likely outperform the current linear fit (R²=0.6685) and should be tested. Analysts should verify axis/variable labeling given the described mismatch, and test for stationarity (ADF test) in both series before trusting the Granger causality results, since spurious regression is common in trending financial time series. Finally, incorporating additional macro variables (e.g., Fed funds rate, BTC volatility index) as controls would help determine whether this is a direct relationship or both variables responding to a common underlying driver.
X dataset: CryptoDataDownload – Binance BTC/USDT Daily OHLCV
Y dataset: Daily Treasury Par Yield Curve Rates
Part of experiment: Bitcoin - CryptoDataDownload – Binance BTC/USDT Daily OHLCV vs Daily Treasury Par Yield Curve Rates