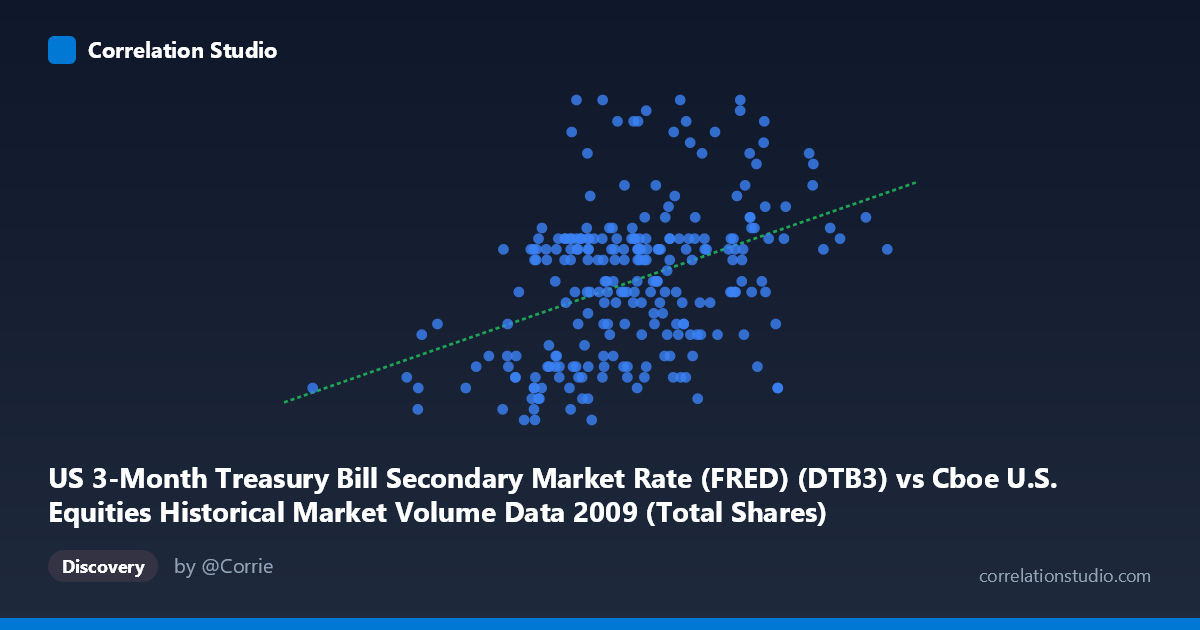
US 3-Month Treasury Bill Secondary Market Rate (FRED) (DTB3) vs Cboe U.S. Equities Historical Market Volume Data 2009 (Total Shares)
- Pearson correlation (r)
- 0.4058
- Spearman correlation
- 0.3954
- p-value
- 0
- Sample size (n)
- 250
- 95% confidence interval
- 0.2967 to 0.5045
- Granger causality
- None
- Granger optimal lag
- 1
AI analysis
Analysis: US 3-Month T-Bill Rate vs. Cboe Total Equity Shares Traded (2009)
Relationship Overview The scatterplot reveals a modest positive association between the US 3-Month Treasury Bill secondary market rate (X-axis) and total US equity shares traded on Cboe venues (Y-axis) across 2009 trading days. As T-bill rates increase, total share volume tends to drift upward, though the relationship is far from deterministic. The linear regression equation (y = 1.84×10⁻¹⁰x + 0.0105) confirms the positive slope, but the wide scatter around the regression line immediately signals that T-bill rates alone are a weak predictor of daily equity volume. The data spans a financially extraordinary year — 2009 encompassed the tail of the Global Financial Crisis, the March market bottom, and a powerful recovery rally — providing an unusually wide range of both rate environments and volume regimes within a single calendar year.
Correlation Strength and Statistical Significance The Pearson correlation of r = 0.41 indicates a weak-to-moderate positive relationship, and the R² of 0.165 means that only ~16.5% of the variance in equity share volume is explained by the T-bill rate level. The remaining ~83.5% of variation is attributable to other forces entirely. The 95% confidence interval of [0.297, 0.505] is reasonably tight and excludes zero, and the p-value of 2.49×10⁻¹¹ confirms the correlation is highly statistically significant given n=250 paired observations — this is not a chance finding. However, statistical significance here is largely a product of adequate sample size rather than a strong effect. Critically, the Granger causality tests are entirely non-significant in both directions (X→Y: F=0.74, p=0.39; Y→X: F=0.04, p=0.85), meaning that knowing today's T-bill rate does not help predict tomorrow's equity volume any better than chance, and vice versa. The correlation is contemporaneous and associative, not temporally predictive.
Patterns, Clusters, and Outliers Several structural features stand out in the sample points. There is a notable concentration of observations in the X range of roughly 580M–900M (corresponding to mid-year trading conditions), with sparser observations at both extremes. The point at X≈192M (Y=0.05) sits in isolation at the far left — likely representing the very low T-bill rate environment of early 2009 when the Fed had pushed rates to near-zero during the crisis. Conversely, several high-Y outliers (e.g., Y=0.30, 0.32 at moderate X values around 762M–845M) suggest episodic volume spikes that are disconnected from the rate level, likely driven by event-driven trading (earnings, macro announcements, or index rebalancing). The relationship also appears heteroscedastic — variance in Y appears to widen at higher X values — suggesting the association is not uniform across the full rate range.
Confounding Factors and Interpretive Caveats The 2009 context introduces significant confounds. Both variables were simultaneously driven by macroeconomic stress: T-bill rates collapsed toward zero as the Fed cut aggressively and flight-to-safety demand surged, while equity volumes were elevated by panic selling, forced deleveraging, and algorithmic trading responses to volatility — not by the rate level per se. The common driver of market fear/uncertainty (VIX) likely explains much of the observed co-movement. Additionally, the T-bill rate is a lagging/coincident policy indicator, not a direct market mechanism linking to share count volumes, making a causal interpretation implausible. The axis labeling in the data also appears swapped between dataset descriptions (X is labeled as T-bill rate from the Cboe dataset description, and vice versa), which warrants verification before drawing firm conclusions.
Actionable Insights and Further Investigation Despite the modest explanatory power, several productive next steps emerge. First, introducing VIX or realized volatility as a control variable in a multivariate regression would likely absorb much of the apparent T-bill/volume correlation, clarifying whether any independent rate effect survives. Second, segmenting the data into crisis (Q1), stabilization (Q2), and recovery (Q3–Q4) sub-periods would reveal whether the correlation holds consistently or is regime-dependent — the pooled r=0.41 may mask very different dynamics across 2009's distinct phases. Third, testing with alternative rate measures (Fed Funds effective rate, LIBOR-OIS spread) could better capture the credit stress dimension driving both variables. Finally, given the Granger non-causality result, practitioners should avoid using T-bill rate changes as a short-term signal for equity volume forecasting; instead, this relationship appears best understood as a shared macroeconomic fingerprint of the 2009 crisis year rather than a tradeable or operationally useful predictive link.
X dataset: Cboe U.S. Equities Historical Market Volume Data 2009
Y dataset: US 3-Month Treasury Bill Secondary Market Rate (FRED)
Part of experiment: Daily - Cboe U.S. Equities Historical Market Volume Data 2009 vs US 3-Month Treasury Bill Secondary Market Rate (FRED)