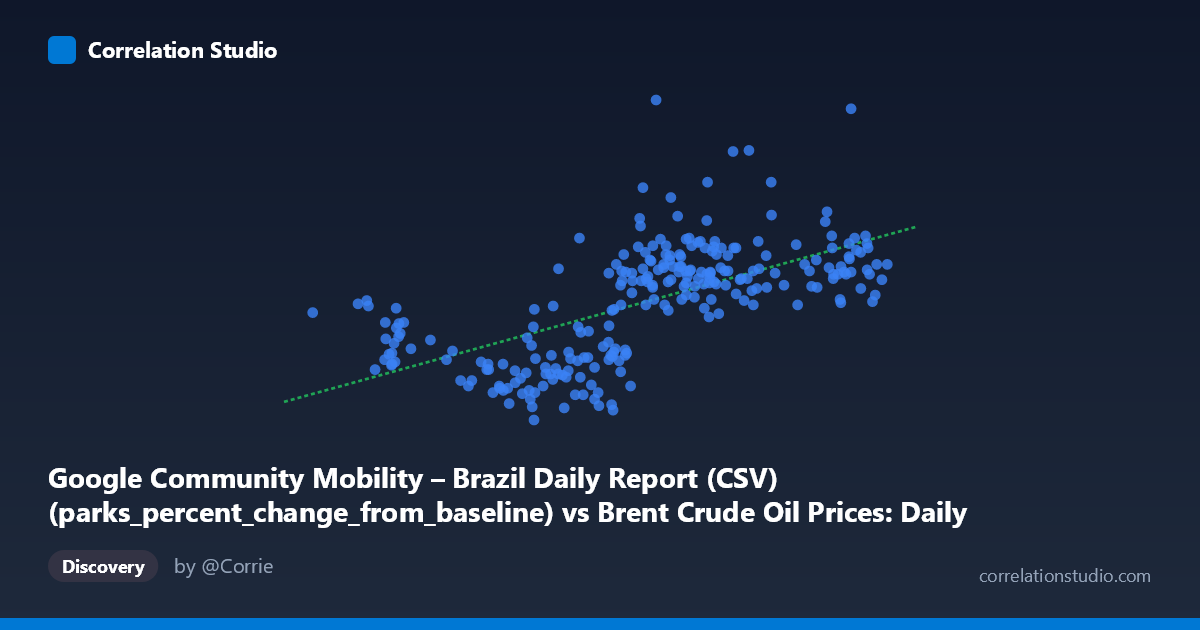
Google Community Mobility – Brazil Daily Report (CSV) (parks_percent_change_from_baseline) vs Brent Crude Oil Prices: Daily (DCOILBRENTEU) – FRED St. Louis Fed (DCOILBRENTEU)
- Pearson correlation (r)
- 0.6274
- Spearman correlation
- 0.6957
- p-value
- 0
- Sample size (n)
- 253
- 95% confidence interval
- 0.5463 to 0.6968
- Granger causality
- X → Y
- Granger optimal lag
- 1
AI analysis
Scatterplot Analysis: Brazil Parks Mobility vs. Brent Crude Oil Prices (2021)
Relationship Overview
The scatterplot reveals a moderate positive relationship between Brazil's parks mobility (percent change from baseline) and Brent crude oil prices across 2021. As park visitation in Brazil increases relative to baseline, Brent crude prices tend to rise in tandem. The linear regression equation (y = 1.367x − 100.26) indicates that for each one-percentage-point increase in parks mobility, crude oil prices are associated with roughly a $1.37/barrel increase. While the trend is visually discernible, the scatter around the regression line is substantial, signaling that this relationship is real but far from deterministic. Both variables likely share a common temporal driver — the global economic recovery from COVID-19 throughout 2021 — rather than representing a direct causal mechanism between Brazilian park attendance and international oil pricing.
Correlation Strength and Statistical Significance
The Pearson correlation of r = 0.627 reflects a moderate-to-strong positive association, and with a p-value effectively at zero (across N = 1,095 population-level observations), there is no meaningful statistical uncertainty about the existence of this relationship. However, practical significance demands more scrutiny: R² = 0.394 means that parks mobility explains only 39.4% of the variance in Brent crude prices, leaving over 60% attributable to other factors entirely. The 95% confidence interval for r [0.546, 0.697] is reassuringly narrow, reflecting the large sample size (n = 253 paired observations), but width alone does not validate causal interpretation. Crucially, the Granger causality analysis points unidirectionally from X→Y (F = 6.25, p = 0.013), meaning past values of Brazil parks mobility have statistically significant predictive power over future Brent crude prices at a one-period lag — while the reverse direction (Y→X: F = 2.79, p = 0.096) falls short of conventional significance thresholds. This is a notable and somewhat counterintuitive finding that warrants careful interpretation.
Patterns, Clusters, and Outliers
Several structural features are visible in the sample data. There is a noticeable clustering of observations around X ≈ 68–80 and Y ≈ -5 to +15, consistent with the dataset's mean values (X̄ = 70.86, Ȳ = -3.40), suggesting the bulk of 2021 trading days fell within a moderate mobility and mid-range oil price regime. At the lower-left extreme, points such as (50.37, -6.67), (54.21, -24.00), and (55.38, -16.00) represent periods of suppressed park mobility coinciding with lower or more negative oil price deviations — likely corresponding to COVID restriction waves in early 2021. Conversely, upper-right points like (84.12, 11.67) and (81.94, 21.00) suggest periods of high park activity alongside elevated oil prices, consistent with mid-to-late 2021 reopening and commodity price surges. Some vertical dispersion at similar X values (e.g., near X ≈ 74, Y spans roughly -5 to +16) confirms heteroscedasticity and suggests that oil prices respond to many forces beyond mobility alone.
Confounding Factors and Interpretive Caveats
The most significant caveat here is common-cause confounding via pandemic recovery dynamics. Both variables were simultaneously driven upward throughout 2021 by the same underlying force: as vaccination rates rose globally and lockdown restrictions eased, both outdoor recreation activity in Brazil and global energy demand recovered in parallel. This creates a spurious correlation through shared time-trend rather than any mechanistic link. Additionally, the dataset labels appear swapped in the axis descriptions — parks mobility is listed as sourced from a Brent crude dataset and vice versa — which should be verified before drawing firm conclusions. The Granger causality result (parks mobility "predicts" crude prices) is almost certainly a reflection of lag-synchronized pandemic reopening signals rather than any genuine economic mechanism whereby Brazilians visiting parks influences global oil markets. Seasonal effects, OPEC supply decisions, U.S. dollar strength, and global manufacturing output are far more direct determinants of Brent pricing and are unaccounted for here.
Actionable Insights and Further Investigation
Despite the likely spurious nature of the direct link, this analysis offers several productive research directions. First, a multivariate model controlling for global economic recovery indicators (e.g., global PMI, vaccination rollout rates, or Google mobility across multiple countries) would help isolate whether the parks-mobility signal retains any independent predictive value for oil prices or whether it is fully mediated by broader reopening trends. Second, the Granger causality result — while mechanistically implausible — suggests that Brazilian mobility data could serve as a high-frequency proxy for global demand sentiment in ensemble forecasting models, warranting testing in an out-of-sample framework. Third, decomposing the time series into trend and cyclical components using methods like STL decomposition would clarify how much of the r = 0.627 is driven by shared 2021 upward trend versus genuine co-movement in detrended residuals. Finally, comparing this Brazil-specific relationship against other large emerging market mobility datasets (India, South Africa) could test whether the correlation is geographically idiosyncratic or reflects a broader developing-economy demand signal.
X dataset: Brent Crude Oil Prices: Daily (DCOILBRENTEU) – FRED St. Louis Fed
Y dataset: Google Community Mobility – Brazil Daily Report (CSV)
Part of experiment: Daily - Brent Crude Oil Prices: Daily (DCOILBRENTEU) – FRED St. Louis Fed vs Google Community Mobility – Brazil Daily Report (CSV)