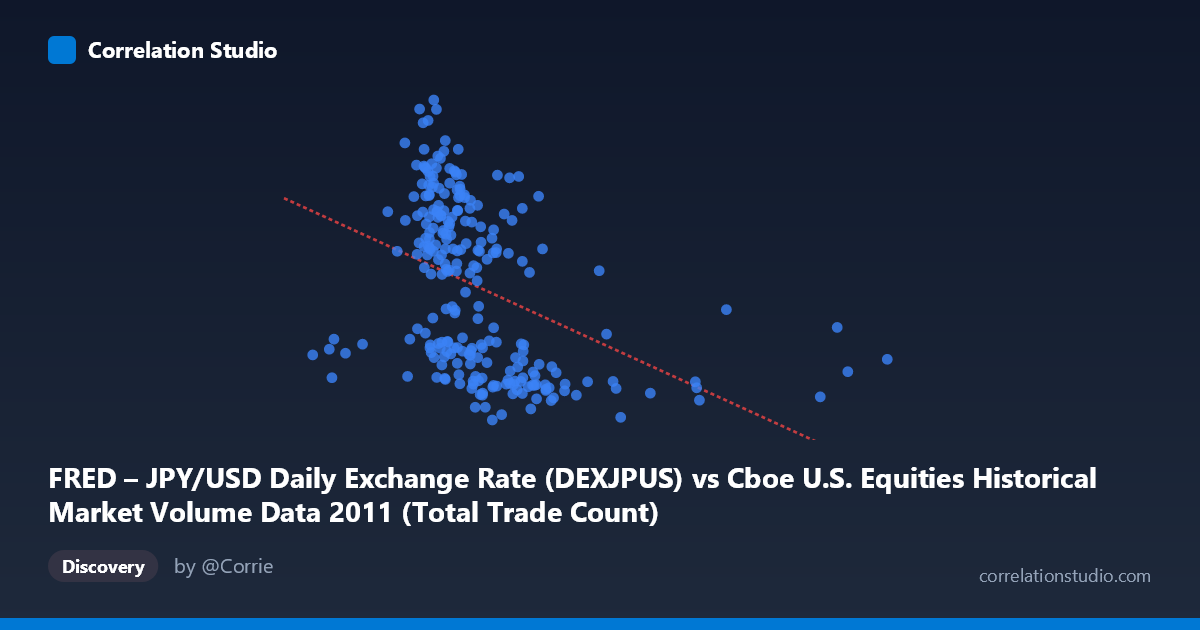
FRED – JPY/USD Daily Exchange Rate (DEXJPUS) vs Cboe U.S. Equities Historical Market Volume Data 2011 (Total Trade Count)
- Pearson correlation (r)
- -0.4069
- Spearman correlation
- -0.555
- p-value
- 0
- Sample size (n)
- 250
- 95% confidence interval
- -0.5055 to -0.2979
- Granger causality
- None
- Granger optimal lag
- 1
AI analysis
Analysis: JPY/USD Exchange Rate vs. U.S. Equity Market Trade Count (2011)
Relationship Overview
The scatterplot reveals a modest negative relationship between the JPY/USD daily exchange rate (X-axis) and U.S. equities total trade count (Y-axis) across 2011. As the yen-per-dollar rate increases — meaning the dollar strengthens relative to the yen — total trade counts on U.S. equity markets tend to decline. The linear regression equation (y = -1.89076E-06x + 83.52) captures this downward slope, though the wide scatter around the trend line makes immediately clear that this is a noisy, imprecise relationship rather than a tight coupling. The data points span a substantial X range (roughly 835K to nearly 5M), with the bulk of observations clustering between approximately 1.5M and 2.7M, suggesting a skewed distribution with notable high-end outliers pulling the regression.
Correlation Strength and Statistical Significance
The Pearson r of -0.407 indicates a weak-to-moderate negative correlation, but the R² of 0.166 is the more sobering figure: only 16.6% of the variance in trade count is explained by the exchange rate. The remaining ~83% is attributable to other factors entirely. The 95% confidence interval of [-0.506, -0.298] confirms the negative direction with reasonable certainty and does not cross zero, and the p-value of 2.17E-11 establishes that this relationship is highly statistically significant — not a sampling artifact, given N = 3,780. However, statistical significance here is partly a function of large sample size, and should not be conflated with practical or economic significance. Critically, Granger causality tests find no significant predictive directionality in either direction (X→Y: p = 0.749; Y→X: p = 0.513), meaning neither variable reliably predicts the future values of the other at a one-period lag. The correlation is contemporaneous and associative, not temporally causal.
Notable Patterns, Clusters, and Outliers
Several features stand out in the sample data. The core cluster of observations sits between X values of ~1.5M–2.5M and Y values of ~76–85, forming a diffuse but discernible downward-sloping band. There are notable high-X outliers — particularly the point near X = 4,978,078 with Y ≈ 77.53, and points near 3.8M and 3.3M — which sit far from the main cluster and likely exert disproportionate leverage on the regression slope. On the Y-axis, values near the extremes (85.26 at X ≈ 1.71M; 75.72 at X ≈ 2.13M) suggest considerable volatility in trade counts even within similar exchange rate environments. The Spearman ρ exceeding Pearson r is a meaningful diagnostic flag: the monotonic rank-order relationship is stronger than the linear one, suggesting the true functional form may be logarithmic or polynomial rather than strictly linear, and a log-transformed or curved fit would likely better characterize the data.
Confounding Factors and Interpretive Caveats
Several confounds complicate causal interpretation. 2011 was an exceptionally volatile year for both currency markets and equity volumes — the Tōhoku earthquake and tsunami (March), the U.S. debt ceiling crisis (summer), and the European sovereign debt crisis all caused discrete, concurrent shocks to both the yen (a safe-haven currency) and U.S. market activity. What appears as a structural correlation may largely reflect shared responses to common macro shocks rather than any direct mechanism. Additionally, the X-axis variable is labeled ambiguously (the column appears to be mislabeled across datasets — "DEXJPUS" is yen per dollar, but the axis range in the millions is inconsistent with typical FX values, suggesting X may actually represent trading volume notional value while Y is trade count). If this labeling is inverted or erroneous, the interpretation changes substantially. Furthermore, day-of-week effects, earnings seasons, and index rebalancing events could create spurious co-movement between the two series.
Actionable Insights and Further Investigation
Given the Granger causality null result, practitioners should not use this relationship for short-term predictive trading signals — neither series leads the other in a statistically meaningful way at a one-day lag. However, the contemporaneous correlation warrants further decomposition. Recommended next steps include: (1) re-examining the data with a log or polynomial transformation of X to better capture the non-linear signal indicated by the Spearman-Pearson divergence; (2) segmenting the analysis by identified macro event windows (pre/post March earthquake, pre/post August debt crisis) to test whether the correlation is regime-dependent; (3) adding control variables such as VIX, S&P 500 returns, or broader dollar index (DXY) to partial out shared volatility drivers; and (4) testing longer Granger lags (2–5 periods) since the one-period test may be too restrictive to detect slower-moving transmission channels between currency markets and equity trading behavior.
X dataset: Cboe U.S. Equities Historical Market Volume Data 2011
Y dataset: FRED – JPY/USD Daily Exchange Rate
Part of experiment: Daily - Cboe U.S. Equities Historical Market Volume Data 2011 vs FRED – JPY/USD Daily Exchange Rate