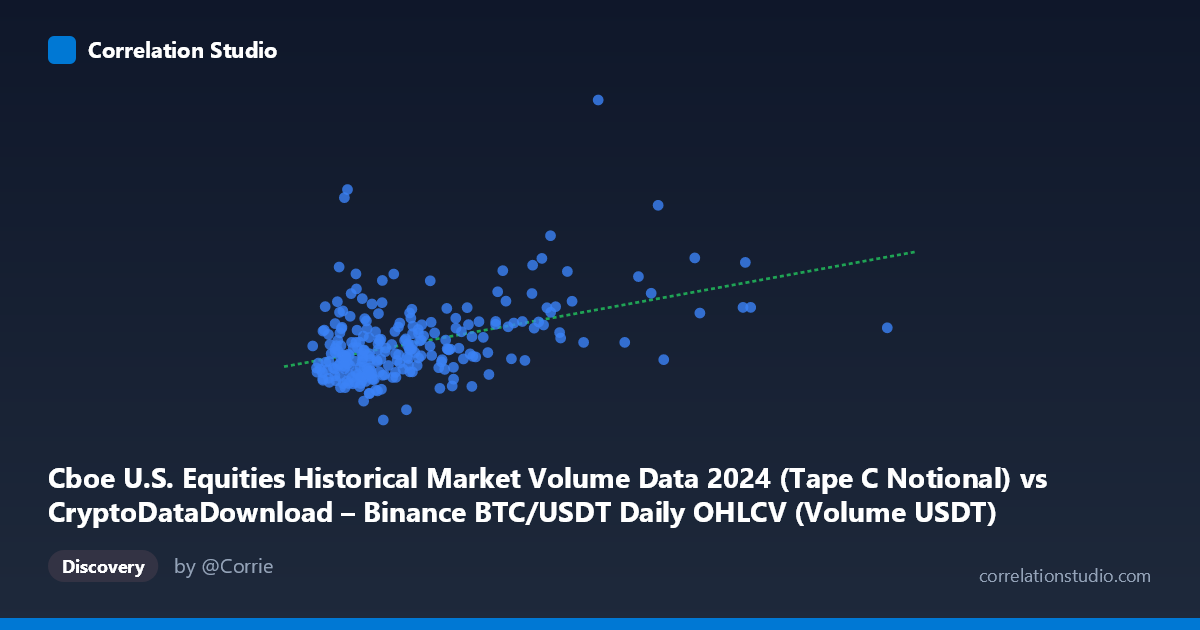
Cboe U.S. Equities Historical Market Volume Data 2024 (Tape C Notional) vs CryptoDataDownload – Binance BTC/USDT Daily OHLCV (Volume USDT)
- Pearson correlation (r)
- 0.4305
- Spearman correlation
- 0.3724
- p-value
- 0
- Sample size (n)
- 252
- 95% confidence interval
- 0.3241 to 0.526
- Granger causality
- None
- Granger optimal lag
- 10
AI analysis
Analysis: Cboe Equities Volume vs. Binance BTC/USDT Volume
1. Overall Relationship
The scatterplot shows a weak-to-moderate positive relationship between the two variables. Most data points cluster in the lower-left region (X between ~1.2B and 3.5B, Y between ~10B and 18B), forming a dense cloud with considerable vertical scatter at any given X value. A smaller number of points extend rightward toward higher X values (5B–11B), and these tend to correspond to somewhat elevated Y values, which is largely responsible for the positive slope in the regression line. However, the scatter within the main cluster is substantial — for X values around 2B, Y ranges anywhere from ~8.6B to ~27.6B, indicating that X alone is a poor predictor of Y in the bulk of the data.
2. Strength, Direction, and Statistical Significance
The correlation coefficient (r = 0.43) indicates a modest positive linear association, and r² = 0.185 tells us that only about 18.5% of the variance in Y (Cboe equities volume) is explained by X (Binance BTC/USDT volume). This leaves over 80% of the variance attributable to other factors or noise. The 95% confidence interval [0.324, 0.526] is reasonably tight and does not cross zero, and the p-value (8.6×10⁻¹³) is extremely small — so we can be confident the correlation is real and not due to chance, given the sample size. However, statistical significance here reflects precision of estimation, not practical strength: a modest but genuine correlation exists, not a strong predictive relationship. Critically, the Granger causality tests (F ≈ 0.83–0.87, p ≈ 0.56–0.60 in both directions) show no evidence of temporal predictive causality in either direction at the optimal 10-period lag. This suggests the correlation is contemporaneous/coincidental (or driven by a shared external factor) rather than one series leading or forecasting the other over time.
3. Patterns, Clusters, and Outliers
Several notable features stand out: - Dense low-X cluster: The majority of points sit in a tight X range (1B–3.5B), suggesting relatively stable/typical daily crypto volumes with equities volume varying independently. - High-Y outliers at low X: Points like (2287214424.71, 8605633940.20) — the Y minimum — and (1665541539.71, 27644015764.99) — a Y spike — show that low crypto volume days can coincide with either very low or very high equities volume, undermining a strong linear link. - Right-tail X points: Observations like (6722807908.33, 20452587209.83) and (8580928177.43, 21623028422.16) pull the regression slope upward; without these few high-X points, the correlation would likely be weaker. These may be disproportionately influential (leverage points). - No clear non-linear curvature (e.g., logarithmic or exponential shape) is evident; the relationship looks broadly linear-diffuse rather than curved.
4. Confounding Factors and Caveats
Several caveats apply: - Shared macro drivers: Both crypto trading volume and U.S. equities volume can be influenced by common macroeconomic events (Fed announcements, CPI releases, risk-on/risk-off sentiment, holidays), which could produce spurious contemporaneous correlation without any direct causal link between the two markets. - Leverage/outlier sensitivity: With only 252 paired points and several high-X observations sitting far from the main cluster, the regression slope and r² may be disproportionately influenced by a handful of days — a robustness check (e.g., excluding top 5% X values) is warranted. - Notional vs. volume mismatch: The X-axis is Cboe notional dollar volume while Y is Binance USDT-denominated volume; differences in market structure, asset denomination, and 24/7 vs. session-based trading could introduce scaling artifacts unrelated to genuine co-movement. - Time aggregation: Daily granularity may mask finer intraday co-movements or lead-lag relationships that the daily Granger test (at 10-day lag) isn't designed to detect.
5. Actionable Insights and Further Investigation
Given the weak r², lack of Granger causality, and outlier sensitivity, this relationship should not be used for predictive trading or hedging strategies linking equities and crypto volumes directly. Suggested next steps: - Test shorter lags (1–3 days) for Granger causality, since 10-period lag may be too coarse to capture short-term volume spillovers. - Investigate exogenous shared drivers (VIX, macro calendar events, weekday/weekend effects) as potential confounders — a multivariate regression controlling for these could clarify whether the r=0.43 correlation survives. - Run the analysis with the outlying high-X points removed or winsorized to assess how much they drive the reported correlation. - Explore whether volatility (rather than volume) in one market better predicts volume in the other, since cross-market volume co-movement is often mediated through shared volatility regimes rather than direct volume-to-volume linkage.
X dataset: CryptoDataDownload – Binance BTC/USDT Daily OHLCV
Y dataset: Cboe U.S. Equities Historical Market Volume Data 2024
Part of experiment: Bitcoin - CryptoDataDownload – Binance BTC/USDT Daily OHLCV vs Cboe U.S. Equities Historical Market Volume Data 2024