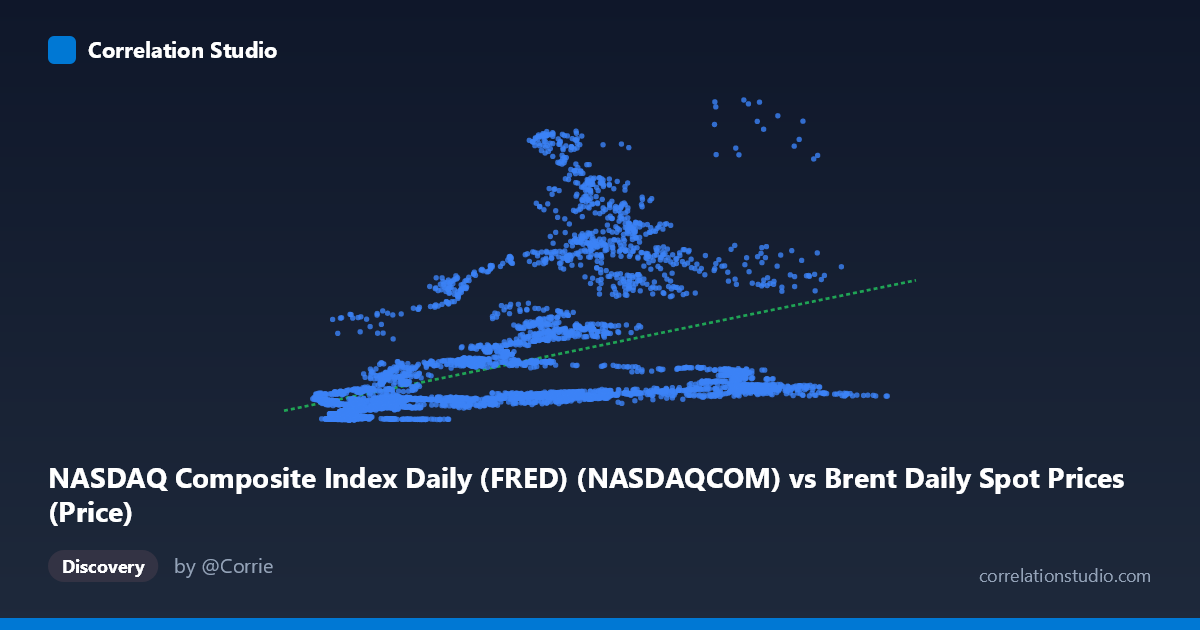
NASDAQ Composite Index Daily (FRED) (NASDAQCOM) vs Brent Daily Spot Prices (Price)
- Pearson correlation (r)
- 0.4518
- Spearman correlation
- 0.7084
- p-value
- 0
- Sample size (n)
- 9718
- 95% confidence interval
- 0.4358 to 0.4675
- Granger causality
- None
- Granger optimal lag
- 9
AI analysis
Analysis: NASDAQ Composite Index vs. Brent Crude Oil Spot Prices (1987–2026)
1. What the Visualization Reveals
The scatterplot depicts the relationship between daily Brent crude oil spot prices (X-axis) and the NASDAQ Composite Index (Y-axis) over nearly four decades. The overall pattern shows a weak-to-moderate positive association, meaning that higher oil prices have generally coincided with higher NASDAQ values across this long historical period. However, the scatter is extraordinarily wide — particularly at lower oil price ranges (roughly $10–$50/barrel), where NASDAQ values span from near zero to well above 20,000. This fan-like dispersion strongly suggests the relationship is heteroscedastic and likely non-linear, with variance in NASDAQ values increasing substantially as oil prices rise into moderate ranges before the relationship diffuses again at higher oil prices.
2. Correlation Strength, Direction, and Temporal Predictability
The Pearson r of 0.4518 indicates a moderate positive correlation, but the r² of 0.2041 is the more sobering statistic — it means that only ~20.4% of the variance in the NASDAQ is explained by Brent crude prices, leaving roughly 80% of NASDAQ variation unexplained by this single variable. The 95% confidence interval of [0.4358, 0.4675] is narrow, reflecting the very large paired sample (n = 9,718), so this estimate is statistically precise and stable. The p-value of effectively zero confirms this correlation is not a chance artifact. That said, statistical significance does not imply practical or mechanistic significance here. Crucially, the Granger causality tests find no significant predictive direction in either direction — neither does oil price predict future NASDAQ values (F = 0.9186, p = 0.508) nor does NASDAQ predict future oil prices (F = 1.3669, p = 0.197) at the optimal 9-period lag. This is a critical finding: even though the two variables are correlated contemporaneously, neither variable "leads" the other in a temporally useful way, undermining any practical trading or forecasting application of this relationship.
3. Notable Patterns, Clusters, and Outliers
Several structural features stand out in the sample data. There is a dense cluster of low oil price / low NASDAQ observations (roughly $10–$30/barrel, NASDAQ below 2,000), consistent with the pre-2000 era when both oil and equity markets were at lower nominal levels. A secondary cluster emerges in the $50–$80/barrel range with moderate NASDAQ values (~2,000–5,000), likely representing the mid-2000s and post-2008 recovery period. Most striking are the extreme outliers with very high NASDAQ values (e.g., 20,585 at $72/barrel and 15,115 at $72/barrel and 14,226 at $82/barrel) — these almost certainly represent the 2020–2024 era when the NASDAQ reached historic highs while oil remained in a moderate range. Conversely, several high oil price observations ($100+/barrel) correspond to only modest NASDAQ levels (~2,500–3,000), likely the 2011–2014 period of elevated oil prices. These temporal clusters are masquerading as a correlation that is largely driven by shared long-run upward trends rather than a genuine structural relationship.
4. Confounding Factors and Interpretive Caveats
The most significant caveat is secular time trends: both Brent crude and the NASDAQ have trended upward over 40 years, driven by inflation, economic growth, and monetary expansion. This shared trend likely inflates the observed correlation considerably — it may be largely spurious cointegration rather than a causal or even meaningful functional relationship. The note that Spearman ρ exceeds Pearson r confirms non-linearity; a linear model with r² = 0.204 is an inadequate description of the data structure, and the linear regression equation (y = 71.77x + 878.25) should not be used for inference. Additional confounders include: global macroeconomic cycles (recessions affect both simultaneously), USD exchange rate effects (both series are dollar-denominated), geopolitical shocks (e.g., Gulf Wars, COVID), and NASDAQ sectoral composition shifts toward tech companies that may actually benefit from lower energy costs.
5. Actionable Insights and Further Investigation
Given that Granger causality is absent and r² is modest, Brent crude should not be used as a standalone NASDAQ predictor. For further investigation, the most valuable next steps would be: (1) detrend both series (e.g., using log-differencing or first differences) to remove spurious shared trends and re-examine whether any genuine contemporaneous or lagged relationship persists; (2) fit a non-linear model (logarithmic or polynomial), as suggested by the Spearman/Pearson divergence, to better capture the true functional form; (3) segment the analysis by economic regime (pre-2000, 2000–2008, 2008–2020, 2020–present) to test whether the relationship is stable or structurally shifting across periods; and (4) consider multivariate models incorporating interest rates, USD index, and VIX to properly isolate any residual oil-NASDAQ relationship. The current correlation is likely an artifact of parallel long-run nominal growth rather than evidence of a reliable or actionable economic linkage.
X dataset: Brent Daily Spot Prices
Y dataset: NASDAQ Composite Index Daily (FRED)
Part of experiment: Daily - Brent Daily Spot Prices vs NASDAQ Composite Index Daily (FRED)