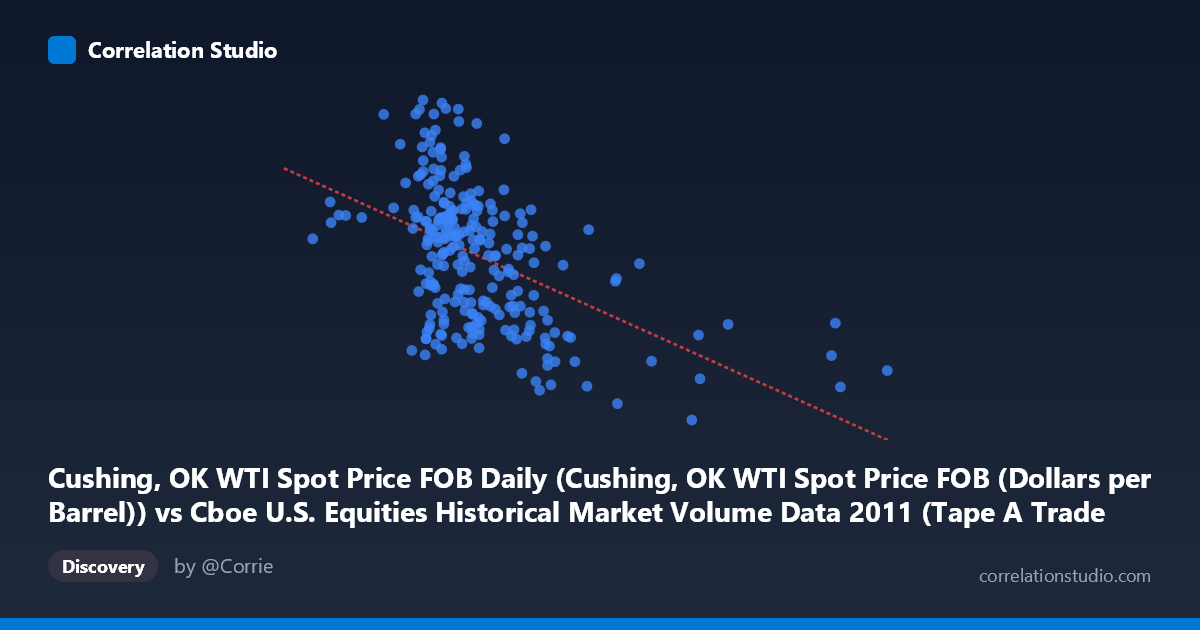
Cushing, OK WTI Spot Price FOB Daily (Cushing, OK WTI Spot Price FOB (Dollars per Barrel)) vs Cboe U.S. Equities Historical Market Volume Data 2011 (Tape A Trade Count)
- Pearson correlation (r)
- -0.4937
- Spearman correlation
- -0.4827
- p-value
- 0
- Sample size (n)
- 252
- 95% confidence interval
- -0.5818 to -0.3942
- Granger causality
- Y → X
- Granger optimal lag
- 1
AI analysis
Analysis: WTI Crude Oil Prices vs. Cboe Tape A Trade Count (2011)
Relationship Overview The scatterplot reveals a moderate negative relationship between WTI crude oil spot prices (X-axis) and Cboe U.S. Equities Tape A trade counts (Y-axis) across 252 trading days in 2011. As oil prices rise, equity trade counts on Tape A tend to decline, and vice versa. The linear regression equation (y = -1.26248E-05x + 109.969) confirms this inverse slope, suggesting that for every incremental increase in oil price-related volume metrics, trade count decreases modestly but consistently. The data cloud is fairly dispersed, indicating the relationship is real but far from deterministic, with considerable scatter around the trend line throughout the price and volume ranges observed.
Correlation Strength and Statistical Significance The correlation of r = -0.4937 represents a moderate negative association — meaningful but not dominant. Critically, R² = 0.2437 tells us that only 24.4% of the variance in Tape A trade counts is explained by WTI oil prices, meaning roughly three-quarters of the variation in equity trading activity is driven by other factors entirely. The 95% confidence interval of [-0.5818, -0.3942] is reasonably tight and lies entirely in negative territory, lending confidence that the inverse direction is genuine and not a sampling artifact. The p-value of effectively 0 confirms this relationship is highly statistically significant across the population of N = 3,780 observations. The Granger causality results add an important temporal dimension: Y Granger-causes X (F = 4.2369, p = 0.0406) at a 1-period lag, meaning that equity trade counts have modest predictive power over future oil price movements, while the reverse (oil prices predicting trade counts) shows no significant Granger causality (F = 0.0339, p = 0.854). This asymmetry suggests equity market activity may be a slight leading indicator for oil prices in 2011, rather than oil prices driving trading behavior.
Notable Patterns, Clusters, and Outliers Several features stand out in the sample points. There is a visible cluster of observations concentrated in the X range of roughly 950,000–1,300,000, which corresponds to the bulk of typical trading days, suggesting most of 2011 saw relatively stable oil-price-related activity with trade counts scattered between ~85 and ~108. However, there are notable outliers at the high end of X — points near 1,876,408, 2,126,541, and beyond — which tend to have lower-than-average Y values (e.g., 93.96 and 85.48 respectively), consistent with the negative trend but pulling the regression line. On the low X end, the point near 567,044 shows a relatively elevated trade count (~101.29), and the point at 794,121 shows a strikingly high trade count of ~111.68, which is among the highest Y values in the sample. These extreme low-X, high-Y observations may represent unusual market conditions — potentially days of market stress, low oil activity, or heavy equity-specific events — and exert meaningful leverage on the correlation estimate.
Confounding Factors and Interpretive Caveats Several important caveats apply here. First, both variables are time series, and the 2011 period was particularly volatile — marked by the European sovereign debt crisis, U.S. debt ceiling debates, and Arab Spring oil disruptions — meaning shared macroeconomic drivers could create spurious co-movement between oil prices and equity trading volumes without a direct causal mechanism. Second, the Granger causality finding (Y→X) should be interpreted cautiously: Granger causality establishes temporal precedence, not true causality, and a single 1-period lag may simply reflect common responses to the same news cycle. Third, Tape A trade count is a narrow measure of equity market activity (NYSE-listed securities only), which may not generalize to broader market volume. Fourth, the units of X (likely notional value or volume proxy derived from an oil price dataset) warrant careful attention — if X conflates price levels with volume, the interpretation changes substantially. Finally, the R² of 24.4%, while statistically robust, leaves the majority of variance unexplained, cautioning against over-reliance on this relationship for practical inference.
Actionable Insights and Further Investigation Given the Granger causality finding that trade counts precede oil price movements, practitioners monitoring equity market microstructure data could explore whether Tape A activity serves as an early signal for oil market positioning, particularly in stress periods. A natural next step would be to extend the lag structure in the Granger analysis beyond 1 period to test whether predictive power persists or decays, and to apply VAR (Vector Autoregression) modeling to quantify the impulse response more precisely. It would also be valuable to segment the data by market regime — high-volatility vs. low-volatility periods in 2011 — to test whether the correlation strengthens during crisis episodes. Introducing control variables such as VIX (equity fear gauge), USD index, and equity index returns would help disentangle direct oil-equity linkages from macro confounders. Finally, replicating this analysis across multiple years would determine whether the 2011 relationship is structurally persistent or an artifact of that year's unique macro environment.
X dataset: Cboe U.S. Equities Historical Market Volume Data 2011
Y dataset: Cushing, OK WTI Spot Price FOB Daily
Part of experiment: Daily - Cboe U.S. Equities Historical Market Volume Data 2011 vs Cushing, OK WTI Spot Price FOB Daily