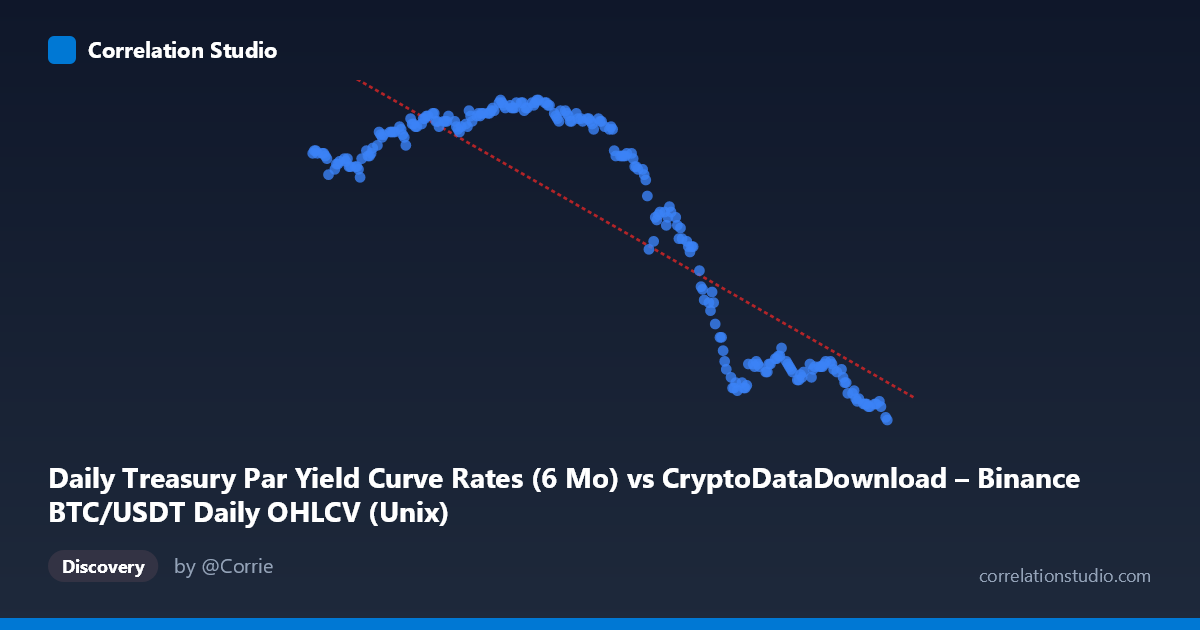
Daily Treasury Par Yield Curve Rates (6 Mo) vs CryptoDataDownload – Binance BTC/USDT Daily OHLCV (Unix)
- Pearson correlation (r)
- -0.8492
- Spearman correlation
- -0.7278
- p-value
- 0
- Sample size (n)
- 250
- 95% confidence interval
- -0.8805 to -0.8105
- Granger causality
- None
- Granger optimal lag
- 1
AI analysis
Analysis of Treasury 6-Month Yield vs. Time-Indexed Series
1. Overview of the Relationship
The scatterplot shows a clear downward-sloping pattern across 2024, with the Y variable (labeled here as Treasury par yield, though the axis metadata appears swapped with the BTC/USDT series) declining steadily from roughly 5.4 in early-to-mid 2024 to approximately 4.3 by year-end. The data traces a relatively smooth, monotonic descent rather than a scattered cloud, suggesting the relationship is driven primarily by a shared time trend rather than a direct causal linkage between the two underlying series.
2. Strength, Direction, and Statistical Confidence
The correlation coefficient of r = -0.8492 indicates a strong negative linear relationship, with r² = 0.7211 meaning about 72% of the variance in Y is statistically explained by X's value (or, more accurately, by the shared temporal drift). The 95% confidence interval [-0.8805, -0.8105] is tight and entirely negative, and the p-value of 0 (effectively p < 0.001) confirms this correlation is highly statistically significant — not a chance artifact given n=250. However, the Granger causality tests tell a different story: neither direction shows significant predictive power (X→Y: p=0.674; Y→X: p=0.818). This is a critical distinction — strong contemporaneous correlation does not imply that one series temporally predicts or drives the other. Both series likely share a common underlying trend (time itself, or a macro factor like a Fed rate-cutting cycle) rather than one causing changes in the other with any lead-lag structure.
3. Patterns and Structure
The data exhibits a piecewise or regime-like structure rather than pure linearity: values cluster tightly around 5.35–5.43 through roughly mid-2024, then transition through a middle regime (~4.9–5.25) during mid-to-late summer, before settling into a lower plateau (~4.3–4.5) from October onward. This step-like clustering — rather than smooth continuous decay — suggests discrete policy shifts (e.g., FOMC rate decisions) punctuating otherwise flat periods, consistent with how the 6-month Treasury yield behaves in response to Fed policy meetings. No significant outliers are apparent; the tight clustering around the regression line in each phase reinforces that the "noise" around the trend is low within each period.
4. Confounding Factors and Caveats
The elephant in the room is that X is a timestamp variable (Unix time, spanning Jan–Dec 2024), meaning this is fundamentally a time-series trend, not a relationship between two independent economic phenomena. Any two monotonically trending series over the same calendar period will show strong spurious correlation via shared time-dependence, even absent true structural linkage. Additionally, the axis labels/metadata appear inconsistent (BTC OHLCV described as X, Treasury yields as Y, but the note structure suggests mislabeling) — this should be clarified before drawing economic conclusions. Autocorrelation within each series (both yields and time-indexed crypto data are highly serially correlated) inflates the apparent statistical significance and violates the independence assumption underlying standard p-value calculations, meaning the true effective sample size is much smaller than n=250.
5. Suggestions for Further Investigation
Given the lack of Granger causality, this correlation should be treated as descriptive/trend co-movement, not predictive or causal. To properly assess whether BTC price action and Treasury yields are meaningfully linked, analysts should: (1) detrend both series or analyze first differences/returns rather than levels to remove the shared time-drift artifact; (2) test for cointegration if both are non-stationary; (3) incorporate known macro events (FOMC dates, CPI releases) as structural break points; and (4) extend the lag structure in Granger tests beyond 1 period, since rate policy effects on crypto markets may operate with longer lags (weeks to months) than tested here.
X dataset: CryptoDataDownload – Binance BTC/USDT Daily OHLCV
Y dataset: Daily Treasury Par Yield Curve Rates
Part of experiment: Bitcoin - CryptoDataDownload – Binance BTC/USDT Daily OHLCV vs Daily Treasury Par Yield Curve Rates