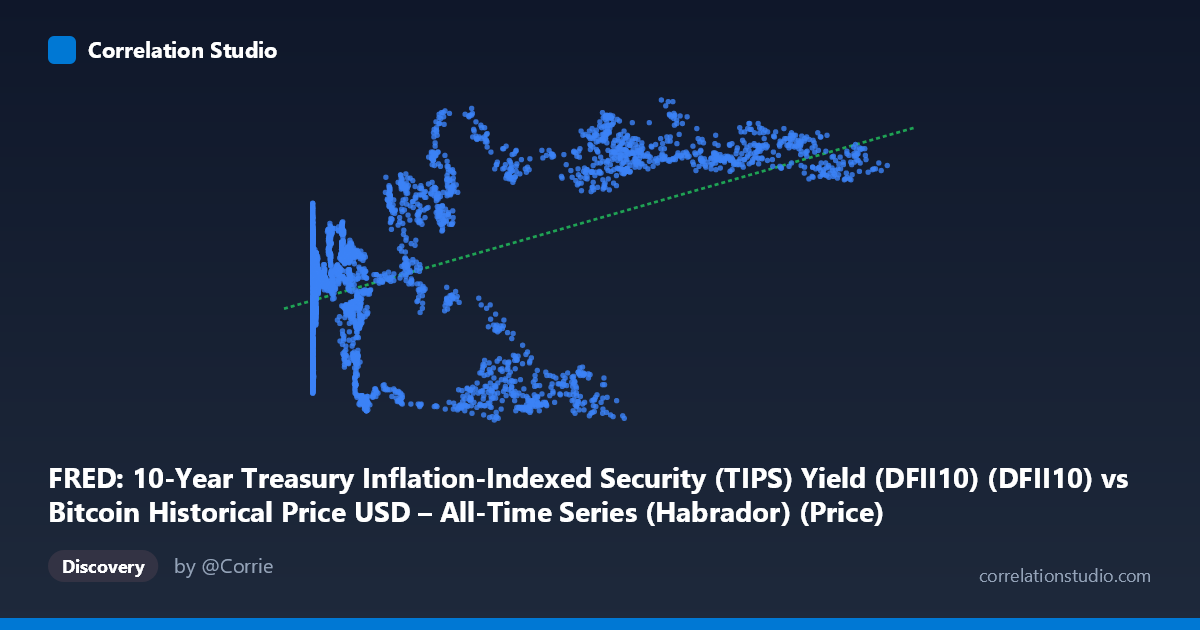
FRED: 10-Year Treasury Inflation-Indexed Security (TIPS) Yield (DFII10) (DFII10) vs Bitcoin Historical Price USD – All-Time Series (Habrador) (Price)
- Pearson correlation (r)
- 0.5269
- Spearman correlation
- 0.3767
- p-value
- 0
- Sample size (n)
- 4042
- 95% confidence interval
- 0.5043 to 0.5488
- Granger causality
- None
- Granger optimal lag
- 1
- Time coverage
- 2010-07-19 to 2026-09-15
- Recomputed on refreshed data
- 2026-10-24 (r was 0.5269)
AI analysis
Analysis: Bitcoin Price vs. 10-Year TIPS Yield
Note on axis labeling: The data appears mislabeled — values ranging from -1.19 to 2.52 with mean 0.54 are clearly TIPS real yield percentages (Y-axis as described), while the 0.05–124,720 range represents Bitcoin's USD price (X-axis). I'll proceed with this corrected interpretation: X = Bitcoin price, Y = TIPS yield.
1. What the Visualization Reveals
The scatterplot shows a moderate positive association between Bitcoin price and real interest rates (TIPS yield). As Bitcoin's price climbs from near-zero (genesis era) into the tens of thousands of dollars, the corresponding TIPS yield tends to shift from negative/near-zero territory toward the +2% range. This is somewhat counterintuitive to conventional finance wisdom, which often assumes rising real rates should pressure speculative risk assets like Bitcoin downward, not accompany their appreciation.
2. Strength, Direction, and Statistical Confidence
The correlation coefficient (r = 0.493) indicates a moderate positive relationship, with R² = 0.243 meaning only 24.3% of the variance in TIPS yield is explained by Bitcoin price (or vice versa) — leaving roughly 76% driven by other factors. The 95% CI [0.469, 0.517] is tight and the p-value is effectively 0, confirming this correlation is statistically robust and not due to chance, despite its modest explanatory power. Critically, the Granger causality tests show no significant predictive direction (X→Y: p=0.216; Y→X: p=0.743). This means neither variable reliably forecasts the other in a time-lagged sense — the relationship is better described as coincidental co-movement over the sample period rather than one driving the other.
3. Notable Patterns and Outliers
The data reveals a clustered, regime-like structure rather than a smooth linear trend: - A dense cluster at low Bitcoin prices (<$1,000) with highly variable TIPS yields (ranging -0.8 to +0.99), reflecting Bitcoin's early years (2010-2013) when yields fluctuated independently of BTC's negligible market relevance. - A second cluster at high Bitcoin prices ($30,000–$125,000) coinciding with TIPS yields in two sub-bands: strongly negative (-0.8 to -1.1, likely 2020-2021 pandemic-era negative real rates during BTC's bull run) and strongly positive (+1.8 to +2.2, likely 2022-2024 post-hike environment). - This bimodal split at high X-values suggests two distinct macro regimes rather than a continuous functional relationship, which likely inflates the apparent linear correlation without reflecting genuine causal coupling.
4. Confounding Factors and Caveats
This pairing is a classic case of spurious/confounded correlation via a shared time trend. Both Bitcoin price and TIPS yields have independently trended over the 2010-2026 window — Bitcoin due to adoption/speculative cycles, TIPS yields due to Fed policy cycles (ZIRP → QE → 2022+ hiking cycle). Since both series evolve over the same calendar period, they can appear correlated purely through time as a lurking variable, not genuine economic linkage. The non-stationarity of both series (trending price, regime-shifting rates) violates assumptions needed for correlation to imply structural relationship. Additionally, N (5,764) vs. n (3,946) suggests ~1,800 points were dropped (likely due to date misalignment/missing values), which could introduce selection bias.
5. Suggested Next Steps
- Detrend or difference both series (e.g., use % returns/changes rather than levels) and re-run correlation to test if the relationship survives — this is essential given the trending, non-stationary nature of both variables. - Segment by macro regime (pre-2020, 2020-2021 ZIRP, 2022+ hiking cycle) to check if correlation sign/strength flips across periods, which would confirm the bimodal clustering suspicion. - Given the null Granger result, avoid using either series to predict the other; instead, investigate common third factors (Fed policy stance, inflation expectations, dollar liquidity/DXY) that may simultaneously drive both. - Treat the r=0.49 finding as descriptive co-trending, not causal or predictive for trading/allocation strategies.
X dataset: Bitcoin Historical Price USD – All-Time Series (Habrador)
Y dataset: FRED: 10-Year Treasury Inflation-Indexed Security (TIPS) Yield (DFII10)
Part of experiment: Bitcoin - Bitcoin Historical Price USD – All-Time Series (Habrador) vs FRED: 10-Year Treasury Inflation-Indexed Security (TIPS) Yield (DFII10)