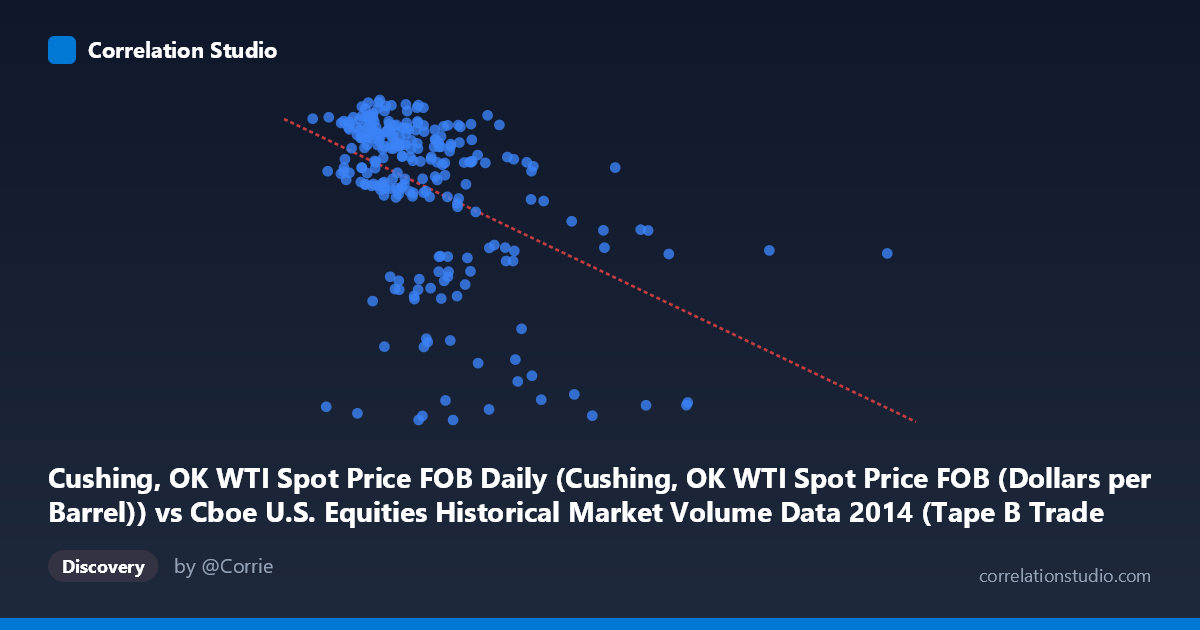
Cushing, OK WTI Spot Price FOB Daily (Cushing, OK WTI Spot Price FOB (Dollars per Barrel)) vs Cboe U.S. Equities Historical Market Volume Data 2014 (Tape B Trade Count)
- Pearson correlation (r)
- -0.4546
- Spearman correlation
- -0.4729
- p-value
- 0
- Sample size (n)
- 252
- 95% confidence interval
- -0.5474 to -0.3507
- Granger causality
- None
- Granger optimal lag
- 2
AI analysis
Analysis: WTI Crude Oil Price vs. Cboe Tape B Trade Count (2014)
Relationship Overview
The scatterplot reveals a negative relationship between WTI crude oil spot prices (X-axis) and Cboe Tape B equity trade counts (Y-axis) across 252 trading days in 2014. The linear regression equation (y = -8.29×10⁻⁵x + 111.54) indicates that as oil prices rise, Tape B trade counts tend to decline, and vice versa. This pattern is visually apparent in the data, though with considerable scatter around the regression line. Notably, the data appears to form a somewhat dispersed cloud with a discernible downward slope, punctuated by what appear to be two distinct behavioral regimes — a cluster of high trade-count observations and a separate cluster of notably low trade-count observations.
Correlation Strength, Direction, and Statistical Significance
The Pearson correlation of r = -0.4546 indicates a moderate negative correlation, but the explanatory power deserves careful framing. The R² of 0.2067 means that WTI oil price accounts for only about 20.7% of the variance in Tape B trade counts — leaving nearly 80% of the variance unexplained by this relationship alone. While the effect size is modest, the statistical evidence is robust: the p-value of 2.95×10⁻¹⁴ is extraordinarily small, and the 95% confidence interval for r of [-0.5474, -0.3507] is entirely negative and reasonably tight, confirming with high confidence that the true population correlation is negative and non-trivial. With N = 3,686 underlying observations and n = 252 paired samples, the finding is well-powered. However, the Granger causality results tell a more cautious story: neither direction (X→Y: F = 1.17, p = 0.312; Y→X: F = 0.51, p = 0.602) achieves significance at the optimal lag of 2 periods. This means that neither variable demonstrably predicts the other temporally — the observed correlation reflects contemporaneous co-movement rather than a predictive or causal lead-lag relationship.
Notable Patterns, Clusters, and Outliers
The scatterplot exhibits a bimodal or clustered structure that is particularly striking. There appears to be a dense upper cluster where Tape B trade counts concentrate between roughly 90–108 (Y-axis), spanning oil prices from approximately $150,000–$350,000 range on the X-axis. Below this, a second, sparser cluster sits at very low trade counts (approximately 54–66), scattered across a wide range of oil prices including both moderate and high values. Points such as (478,251; 55.97), (284,028; 55.25), (154,530; 54.59), and (218,494; 54.14) appear to be structural outliers — these extremely low trade-count days may represent market holidays, exchange-specific disruptions, or data anomalies rather than organic trading behavior. Additionally, several high oil-price observations (e.g., 559,868 at 82.33; 326,248 at 60.99) pull the regression slope downward and may be exerting disproportionate leverage on the correlation estimate. The existence of these two distinct regimes suggests the relationship may not be well-described by a single linear model.
Confounding Factors and Interpretive Caveats
Several important caveats should temper interpretation. First, the axis labels appear to be swapped in the dataset metadata — the X-axis is labeled as coming from the Cboe volume dataset while the Y-axis is labeled from the WTI price dataset, which may indicate a metadata inconsistency worth verifying before drawing conclusions. Second, 2014 was a year of dramatic oil price decline (WTI fell from ~$100 to ~$55/barrel in H2 2014), meaning the X-axis likely encodes a strong time trend — the correlation may largely reflect two concurrent time-series trends rather than a structural relationship between the variables. Third, Tape B trade volume is influenced by a host of market microstructure factors (volatility regimes, algorithmic trading patterns, regulatory changes, seasonal liquidity) that are entirely independent of oil prices. Fourth, the low-trade-count cluster almost certainly represents non-trading or partial-trading days (holidays, early closes), which could artificially inflate the magnitude of the negative correlation if these days also happen to cluster in periods of different oil price levels.
Actionable Insights and Further Investigation
Given the moderate correlation, its temporal non-causality, and the suspicious clustering at very low trade counts, several investigative steps are warranted. First, the low trade-count outliers should be identified and removed or flagged as potential non-standard trading days before re-estimating the correlation — it is likely the true relationship among normal trading days is weaker than r = -0.45. Second, since 2014 oil prices have a strong downward time trend, a detrended or first-differenced analysis (examining day-over-day changes rather than levels) would more cleanly isolate whether oil price movements correlate with trade count changes, independent of shared secular trends. Third, incorporating market volatility (VIX), broader equity index performance (S&P 500), and energy sector equity flows as control variables would help determine whether the oil-trade count relationship is spurious or mediated by risk sentiment. Fourth, extending the Granger causality test to longer lag structures or applying a vector autoregression (VAR) framework with additional control variables could reveal more nuanced temporal dynamics. Finally, examining whether the relationship differs between H1 2014 (stable oil prices) and H2 2014 (collapsing oil prices) via a structural break test (e.g., Chow test) could reveal whether the negative correlation is driven primarily by the dramatic oil price crash of the latter half of the year.
X dataset: Cboe U.S. Equities Historical Market Volume Data 2014
Y dataset: Cushing, OK WTI Spot Price FOB Daily
Part of experiment: Daily - Cboe U.S. Equities Historical Market Volume Data 2014 vs Cushing, OK WTI Spot Price FOB Daily