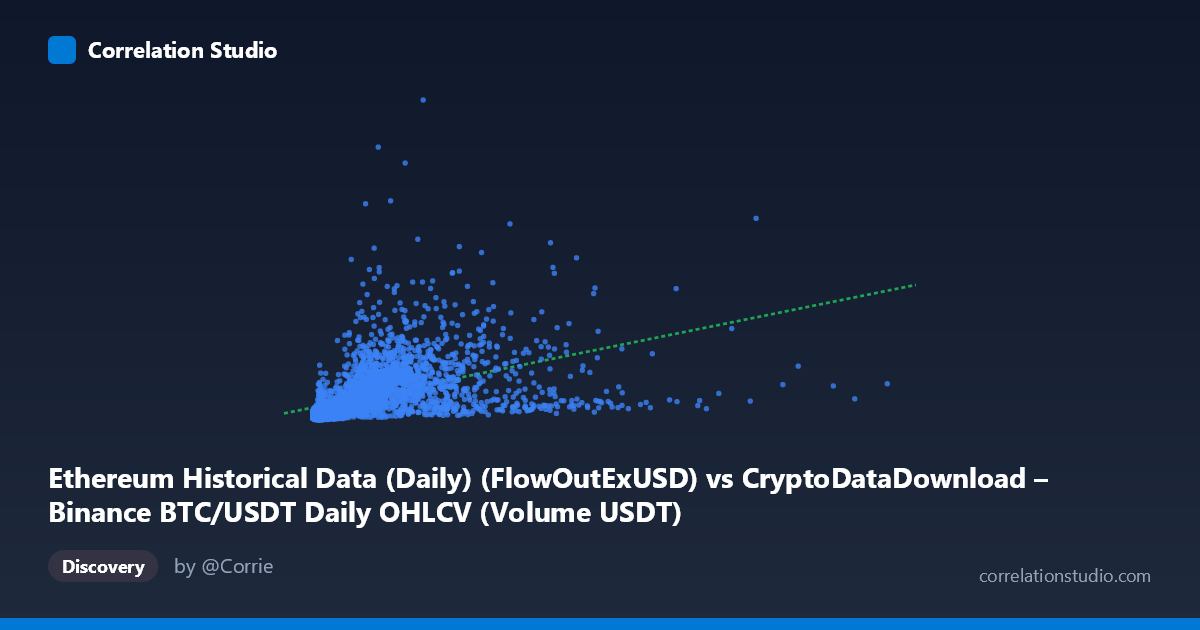
Ethereum Historical Data (Daily) (FlowOutExUSD) vs CryptoDataDownload – Binance BTC/USDT Daily OHLCV (Volume USDT)
- Pearson correlation (r)
- 0.4583
- Spearman correlation
- 0.7434
- p-value
- 0
- Sample size (n)
- 3191
- 95% confidence interval
- 0.4305 to 0.4853
- Granger causality
- None
- Granger optimal lag
- 10
AI analysis
Analysis: ETH FlowOutExUSD vs. BTC/USDT Volume (USDT)
1. What the Visualization Reveals
The scatterplot shows a positive but noisy relationship between the two variables, both of which are heavily right-skewed. This is evident from the summary statistics: X ranges from ~978K to ~17.5 billion (mean 1.75B, stdev 1.9B) and Y ranges from ~14M to ~7.4 billion (mean 569M, stdev 638M). In both series, the standard deviation is comparable to or larger than the mean, indicating a small number of extreme high-value observations pulling the distribution's tail far to the right. The bulk of the sampled points cluster in the lower-left region (X under ~5B, Y under ~1.5B), with a sparse scattering of much larger values extending the axes considerably.
2. Strength, Direction, and Statistical Confidence
The Pearson correlation (r = 0.4583) indicates a moderate positive linear relationship, but r² = 0.2101 means only about 21% of the variance in Y is explained by X — roughly four-fifths of the variability in ETH flow-out volume is driven by other factors entirely unrelated to BTC/USDT trading volume. The 95% CI [0.4305, 0.4853] is fairly tight given the large sample (n=3,191), and the p-value of ~0 confirms the correlation is highly statistically significant — this relationship is real, not due to chance. However, statistical significance with large n is common even for modest effect sizes, so significance should not be conflated with strength or practical importance.
Critically, the Granger causality tests show no significant predictive direction in either direction (X→Y: p=0.635; Y→X: p=0.406). This means that past values of BTC volume do not help forecast future ETH flow-out, nor vice versa, at the tested lag structure (optimal lag = 10 periods). In practical terms: despite the contemporaneous correlation, neither series temporally "leads" the other in a statistically detectable way. This suggests the correlation is likely driven by a shared external factor (e.g., overall crypto market activity/sentiment) rather than one market mechanically driving the other.
3. Notable Patterns and Non-Linear Features
The data show a classic "fan" or "cone" pattern typical of financial volume data — dispersion increases as X increases, a form of heteroscedasticity. Several sample points suggest non-proportional scaling: for instance, (5,065,944,973 → 260,024,445) shows a case where very high X corresponds to relatively low Y, while (7,162,581,994 → 1,688,945,363) shows both high. This inconsistency at the high end contributes to the weak r². The note that Spearman ρ exceeds Pearson r is important: it implies the relationship is monotonic but not linear — likely logarithmic or power-law shaped, consistent with the heavy right-skew in both variables. A log-log transformation would likely reveal a cleaner, more linear relationship and improve model fit.
4. Confounding Factors and Caveats
Both variables are trading/flow volume metrics for two of the largest cryptocurrencies (BTC and ETH), which are known to be strongly influenced by common macro drivers: overall market liquidity, exchange-wide trading activity, regulatory news, and broad "risk-on/risk-off" sentiment shifts. This shared exposure to systemic crypto-market factors is a classic confounder that can inflate correlation without implying direct causal linkage. Additionally, volume data often exhibits autocorrelation and volatility clustering (e.g., around halving events, exchange outages, or major news), which violates independence assumptions underlying Pearson correlation and standard significance testing. The extreme outliers (values in the billions against typical values in the hundreds of millions) may also disproportionately influence r — data should be checked for exchange-specific anomalies, wash trading, or reporting errors.
5. Actionable Insights and Further Investigation
Given the weak temporal causality but real contemporaneous correlation, analysts should treat BTC volume as a coincident indicator rather than a predictive one for ETH flows (and vice versa). Recommended next steps: (1) apply log or Box-Cox transformations to both variables and re-run correlation/regression to test the suspected non-linear (power-law) relationship, which may substantially raise explained variance; (2) test Granger causality on log-differenced or detrended series to remove non-stationarity bias, which could otherwise mask true lead-lag relationships; (3) introduce a common market-wide variable (e.g., total crypto market cap or a volatility index) as a control to assess whether the BTC-ETH volume correlation is fully explained by shared market conditions; and (4) investigate the extreme high-volume outliers individually to determine whether they represent genuine market events or data quality issues before drawing further conclusions.
X dataset: CryptoDataDownload – Binance BTC/USDT Daily OHLCV
Y dataset: Ethereum Historical Data (Daily)
Part of experiment: Bitcoin - CryptoDataDownload – Binance BTC/USDT Daily OHLCV vs Ethereum Historical Data (Daily)