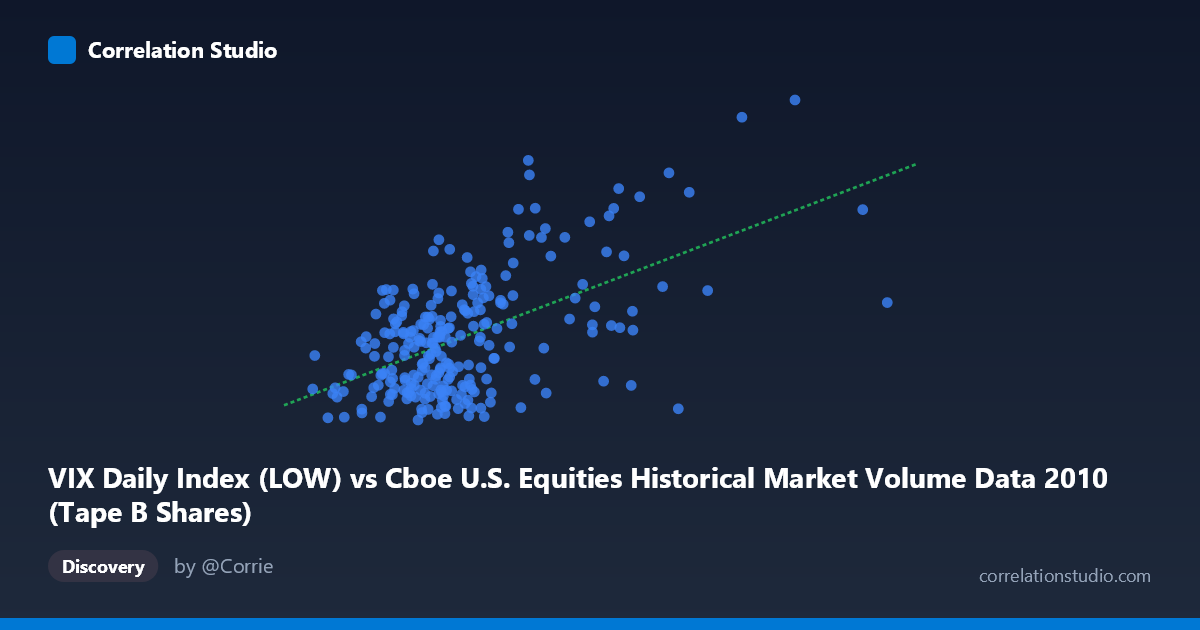
VIX Daily Index (LOW) vs Cboe U.S. Equities Historical Market Volume Data 2010 (Tape B Shares)
- Pearson correlation (r)
- 0.5513
- Spearman correlation
- 0.418
- p-value
- 0
- Sample size (n)
- 252
- 95% confidence interval
- 0.459 to 0.6318
- Granger causality
- Y → X
- Granger optimal lag
- 1
AI analysis
Scatterplot Analysis: VIX Tape B Shares vs. VIX Daily Index (LOW)
Relationship Overview
The scatterplot reveals a moderate positive relationship between the Cboe VIX Daily Index (LOW) values on the X-axis and Tape B share volume on the Y-axis across 252 trading days in 2010. As the VIX low reading increases, Tape B equity volume tends to rise correspondingly, suggesting that periods of elevated baseline volatility are associated with higher trading activity in Tape B securities. The linear regression equation (y = 5.90e-08x + 15.03) indicates a relatively shallow slope, meaning that very large changes in VIX low values are required to produce meaningful shifts in Tape B volume — reflecting the dramatically different scales of the two variables.
Correlation Strength and Statistical Significance
The Pearson correlation of r = 0.5513 indicates a moderate positive association, but the explanatory power deserves careful framing: r² = 0.3039 means that only ~30.4% of the variance in Tape B shares is explained by the VIX low value, leaving nearly 70% attributable to other factors. The 95% confidence interval [0.4590, 0.6318] is reasonably tight and does not approach zero, providing confidence that the relationship is genuine rather than artifactual. The p-value of effectively 0 across a population of N = 3,302 confirms strong statistical significance. Critically, the Granger causality analysis points to a unidirectional temporal relationship: Y Granger-causes X (F = 6.03, p = 0.0148), meaning past Tape B share volume has statistically significant predictive power over future VIX low values, while the reverse direction fails to reach significance (F = 1.80, p = 0.181). This is a notable and somewhat counterintuitive finding — trading volume in Tape B securities appears to lead volatility signals rather than follow them.
Patterns, Clusters, and Outliers
The scatterplot exhibits a broad, cone-shaped or heteroscedastic spread: data points cluster densely in the lower-left region (VIX low roughly 37M–120M, Tape B shares 15–23), with increasing dispersion at higher X values. Several notable outliers occupy the upper-right quadrant, including points near (254M, 39.0), (316M, 31.7), (192M, 33.4), and (147M, 35.6), which represent episodes of simultaneously high volume and elevated volatility — likely corresponding to market stress events in 2010, such as the May Flash Crash. A cluster of points in the mid-range (100M–140M VIX low, 15–22 Tape B) forms the dense core of the distribution, suggesting these represent "normal" trading conditions for 2010. The increasing variance at higher X values is a hallmark of heteroscedasticity, which can affect the reliability of the linear model at extremes.
Confounding Factors and Caveats
Several important caveats temper interpretation. First, the axes represent variables from two different datasets that have been cross-joined — VIX low values from a market volume dataset paired against Tape B share counts from a VIX dataset — raising questions about whether the alignment is conceptually clean or potentially an artifact of data joining methodology. Second, 2010 was an anomalous year featuring the May 6 Flash Crash, which likely inflates both volume and volatility simultaneously, creating influential outliers that could artificially strengthen the correlation. Third, the Granger causality result — that volume predicts volatility rather than vice versa — may reflect liquidity-driven volatility dynamics or order flow information, but with only a lag of 1 period, the economic mechanism warrants scrutiny. Finally, the heteroscedastic spread suggests a linear model may be suboptimal; a log-transformed or power-law model could better characterize the relationship.
Actionable Insights and Further Investigation
The Granger causality finding that Tape B volume leads VIX low values is the most actionable result here and merits deeper investigation. Practitioners and researchers should explore whether Tape B-specific order flow or institutional trading activity serves as an early signal for volatility compression or expansion, potentially useful in volatility forecasting models. It would be worthwhile to: (1) test whether this predictive relationship holds across multiple years beyond 2010 to assess robustness; (2) apply a log transformation to both variables to address heteroscedasticity and potentially improve model fit; (3) investigate the specific dates of high-leverage outliers to confirm whether they correspond to known market events; and (4) incorporate additional covariates such as overall market breadth, VIX term structure slope, or macro announcements to better capture the unexplained ~70% of variance. A VAR (Vector Autoregression) model incorporating both series could formalize and extend the Granger causality finding into a more operationally useful forecasting framework.
X dataset: Cboe U.S. Equities Historical Market Volume Data 2010
Y dataset: VIX Daily Index
Part of experiment: Daily - Cboe U.S. Equities Historical Market Volume Data 2010 vs VIX Daily Index