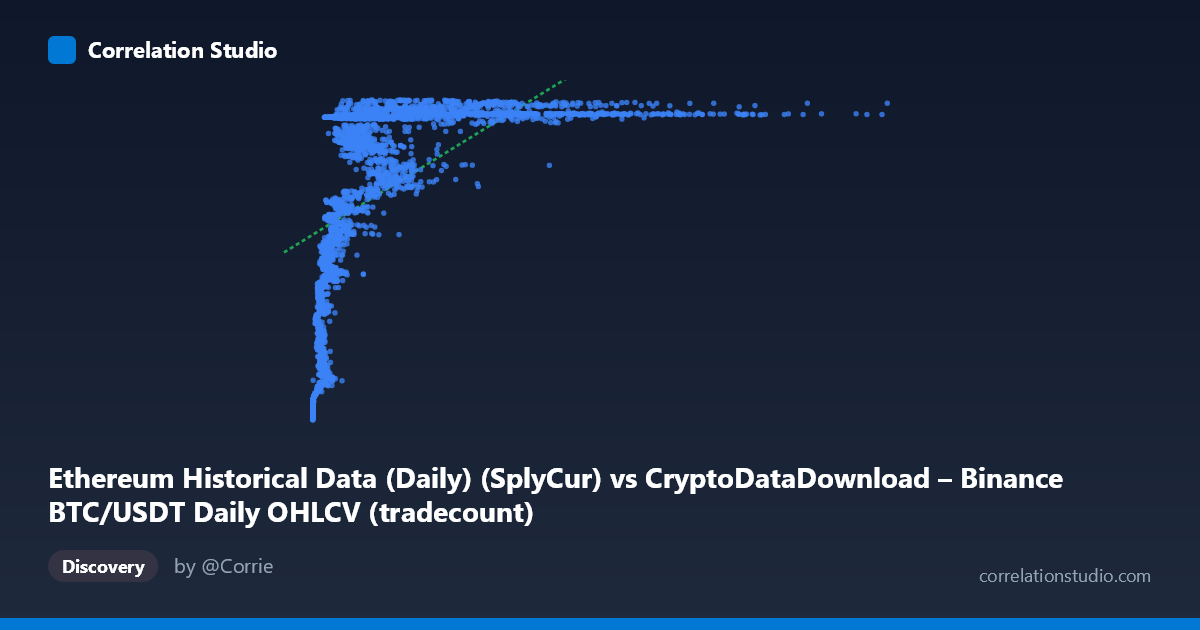
Ethereum Historical Data (Daily) (SplyCur) vs CryptoDataDownload – Binance BTC/USDT Daily OHLCV (tradecount)
- Pearson correlation (r)
- 0.5542
- Spearman correlation
- 0.8316
- p-value
- 0
- Sample size (n)
- 3191
- 95% confidence interval
- 0.5296 to 0.5777
- Granger causality
- X → Y
- Granger optimal lag
- 10
- Time coverage
- 2017-08-17 to 2026-05-20
AI analysis
Analysis: X Variable vs. Y Variable Relationship
1. What the Visualization Reveals
The scatterplot shows a clear non-linear, saturating relationship rather than a simple linear one. At low X values (roughly under 500,000), Y climbs steeply from ~94M to ~115M, indicating high sensitivity in this range. Once X exceeds ~1–2 million, Y flattens into a tight band between 120M–122M regardless of further increases in X (even up to the max of ~15.3M). This pattern — sharp initial rise followed by a plateau — is classic logarithmic/asymptotic behavior, not a proportional linear one.
2. Strength, Direction, and Statistical Confidence
The Pearson correlation (r = 0.554) indicates a moderate positive relationship, with r² = 0.307 meaning linear regression explains only about 31% of the variance in Y — leaving nearly 70% unexplained by a straight-line fit. The 95% CI [0.530, 0.578] is narrow and the p-value is effectively 0, so we can be confident a real association exists and isn't due to chance — but confidence in existence of a relationship is not the same as confidence in its linear form or strength. The note that Spearman ρ exceeds Pearson r reinforces that a monotonic non-linear model (log or power fit) would capture substantially more variance than the linear one reported. On causality: Granger tests show X→Y is significant (F=2.18, p=0.016) while Y→X is not (p=0.765), suggesting X's past values have modest but real predictive power over future Y values, unidirectionally — though the effect size is weak and lag-dependent (10 periods), so this should be treated as suggestive rather than proof of mechanistic causation.
3. Notable Patterns and Outliers
Three regions are visible: (a) a steep-rise cluster at very low X (near-zero to ~300K) where Y ranges from 94M–108M — this is where most of the "explanatory power" lives; (b) a transitional band (~300K–1M) where Y rises from ~108M to ~120M; (c) a dense plateau cluster (X 1M) where Y hugs 120–122M with very low variance. The extreme X outliers (e.g., 8.7M, 15.3M) sit right on the plateau, contributing no additional Y information — they're leverage points that could distort a linear fit despite adding little real signal. This plateau/saturation structure strongly suggests a ceiling effect in Y (e.g., a metric capped by network/exchange capacity or maturity).
4. Confounders and Caveats
Both series are time-indexed daily crypto metrics (2017–2026), so autocorrelation and shared macro trends (bull/bear cycles, adoption growth, exchange listing effects) likely inflate the apparent relationship — this is classic non-stationary time-series correlation risk rather than independent-sample correlation. Ethereum's SplyCur (circulating supply) is a slow, near-monotonic growth series, while BTC/USDT tradecount is a volatile activity metric — the "relationship" may partly reflect that both grew over the same historical era rather than a direct causal link. The linear regression equation and r² are likely misleading given the confirmed non-linear shape; report r² alongside a properly specified non-linear model.
5. Suggested Next Steps
Refit using a logarithmic or power-law model (Y ~ a + b·ln(X)) to better capture the saturation curve, and compare R² against the linear baseline. Detrend or difference both series before Granger testing to rule out spurious correlation from shared trends/non-stationarity (e.g., use ADF tests, then re-run Granger causality on stationary series). Segment the analysis by X range (low vs. high) since the relationship's strength clearly differs by regime — a piecewise or spline model may outperform a single global fit. Finally, since supply curves are mechanically smooth while tradecount is noisy, consider whether a third factor (calendar time, market cycle phase) is the true driver of both, and control for it directly.
X dataset: CryptoDataDownload – Binance BTC/USDT Daily OHLCV
Y dataset: Ethereum Historical Data (Daily)
Part of experiment: Bitcoin - CryptoDataDownload – Binance BTC/USDT Daily OHLCV vs Ethereum Historical Data (Daily)