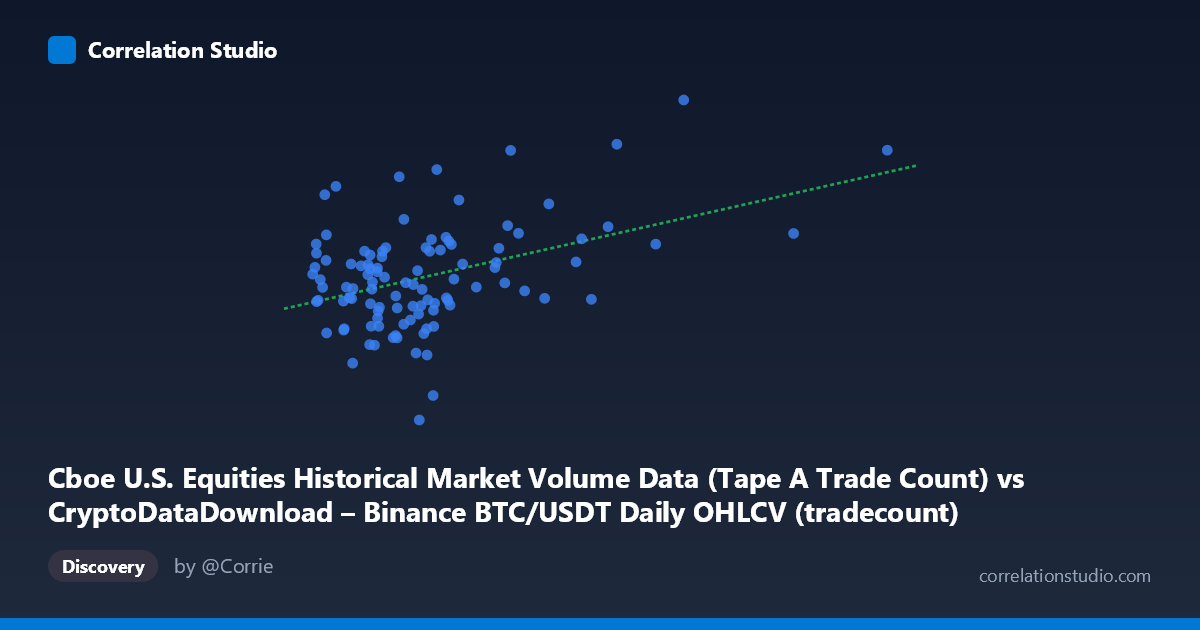
Cboe U.S. Equities Historical Market Volume Data (Tape A Trade Count) vs CryptoDataDownload – Binance BTC/USDT Daily OHLCV (tradecount)
- Pearson correlation (r)
- 0.4223
- Spearman correlation
- 0.2643
- p-value
- 0.000008
- Sample size (n)
- 104
- 95% confidence interval
- 0.25 to 0.5686
- Granger causality
- None
- Granger optimal lag
- 10
- Time coverage
- 2026-01-02 to 2026-06-25
- Recomputed on refreshed data
- 2026-10-23 (r was 0.4223)
AI analysis
Analysis: Cboe Trade Count (Tape A) vs. Binance BTC/USDT Trade Count
1. What the Visualization Reveals
The scatterplot shows a moderate positive relationship between two variables that, on their face, measure unrelated markets: U.S. equities trade counts (Tape A) and Binance BTC/USDT daily trade counts. Most observations cluster tightly in the lower-left region (X between 2.3M–6M, Y between 2.0M–3.0M), with a long right tail of X values extending out to 15.3M. The bulk of the data forms a loose upward-sloping cloud, while a handful of high-X points (6.7M–15.4M) sit at the extremes and disproportionately influence the fitted trend line.
2. Strength, Direction, and Statistical Confidence
The correlation coefficient (r = 0.453) indicates a moderate positive linear relationship, but r² = 0.205 tells the more important story: only about 20% of the variance in Y is explained by X, leaving 80% attributable to other factors or noise. The 95% CI [0.271, 0.604] is fairly wide, reflecting the modest sample size (n=90 paired points), but it excludes zero, and the p-value (7.3×10⁻⁶) confirms the correlation is statistically significant — this is a real, non-random association, just not a strong predictive one.
The Granger causality results add a temporal dimension: X (equities trade count) appears to Granger-cause Y (crypto trade count) at a 10-period lag (F=2.01, p=0.0485), while the reverse direction is not significant (p=0.469). This suggests equities market activity may lead crypto trading activity by about 10 days — though the p-value is only marginally below 0.05, so this should be treated as suggestive rather than conclusive.
3. Notable Patterns and Outliers
Several high-leverage points stand out: the X=15.36M point (Y≈3.33M) and X=13.23M point (Y≈2.89M) are far outside the main cluster and likely exert substantial influence on both the correlation coefficient and regression slope. Similarly, the Y=3.60M point (at X=10.7M) and Y=3.33M point (at X=6.78M) represent upper-tail volume spikes possibly tied to specific high-volatility trading days (e.g., major BTC price moves or macro news events) that spike both markets simultaneously. The dense core cluster (X<6M) shows a much flatter, noisier relationship than the overall trend suggests — the apparent slope is partly an artifact of a few extreme co-occurring high-volume days.
4. Confounding Factors and Caveats
The most significant caveat: both variables likely share a common driver — overall macro/market-wide volatility or risk sentiment. High-volume, high-volatility days in equities (e.g., Fed announcements, macro shocks) often coincide with elevated crypto trading activity, not because one causes the other mechanically, but because both respond to the same news flow and liquidity conditions. Additionally, trade counts scale with market structure changes (exchange algo activity, HFT participation) that are unrelated across these two ecosystems. The mismatched date ranges (2026 dates for BTC data seem forward-looking and time coverage is short — under 5 months) plus n=90 sampled from a larger population of 1,980 also limits generalizability, and daily trade counts are known to be non-stationary/trending, which can inflate Granger causality test significance (spurious lag relationships).
5. Suggested Next Steps
Given the marginal Granger p-value and the influence of outliers, I'd recommend: (1) re-running the correlation and Granger tests with outliers removed or winsorized to test robustness; (2) differencing both series (day-over-day % change) to address non-stationarity before re-testing Granger causality, since raw trade-count levels are likely trending; (3) explicitly controlling for a shared volatility/news-event index (e.g., VIX or crypto fear-greed index) as a potential confounder; and (4) extending the time window beyond ~5 months to increase power and better validate whether the 10-lag Granger relationship persists out-of-sample.
X dataset: CryptoDataDownload – Binance BTC/USDT Daily OHLCV
Y dataset: Cboe U.S. Equities Historical Market Volume Data
Part of experiment: Bitcoin - CryptoDataDownload – Binance BTC/USDT Daily OHLCV vs Cboe U.S. Equities Historical Market Volume Data