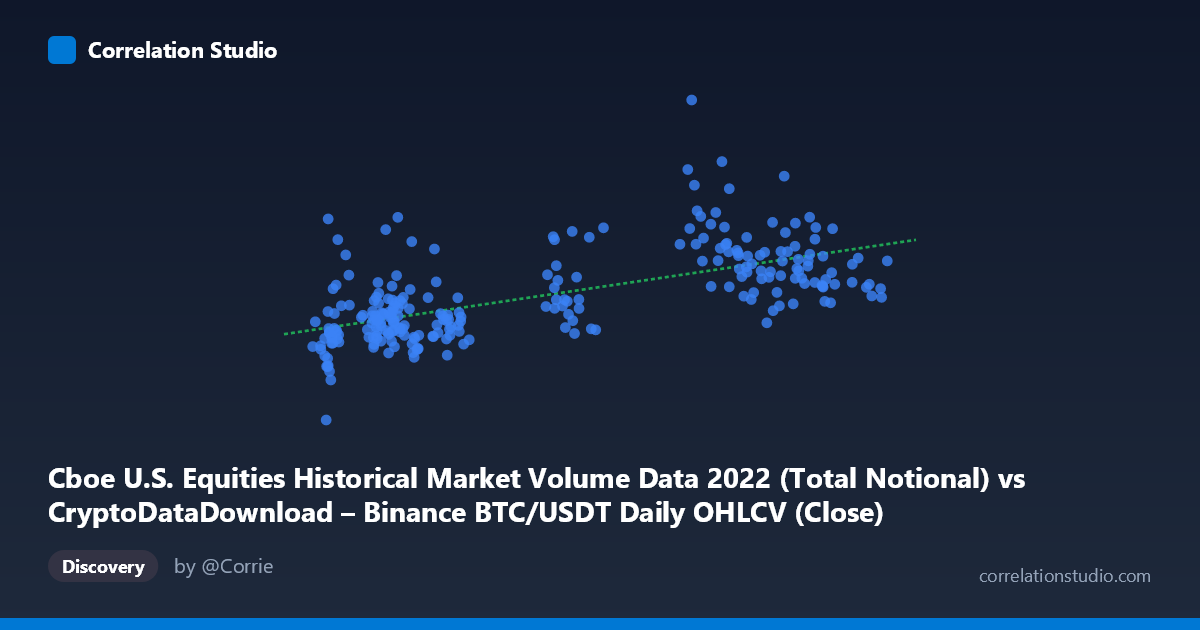
Cboe U.S. Equities Historical Market Volume Data 2022 (Total Notional) vs CryptoDataDownload – Binance BTC/USDT Daily OHLCV (Close)
- Pearson correlation (r)
- 0.6326
- Spearman correlation
- 0.637
- p-value
- 0
- Sample size (n)
- 251
- 95% confidence interval
- 0.5521 to 0.7015
- Granger causality
- None
- Granger optimal lag
- 10
AI analysis
Analysis: Cboe U.S. Equity Volume vs. Binance BTC/USDT Close Price
1. Relationship Overview
The scatterplot shows a moderate positive association between U.S. equities market notional volume (X) and BTC/USDT closing price (Y) across 251 daily observations from 2022. As equity trading volume increases, Bitcoin's closing price tends to rise as well, though the relationship is far from deterministic — there's considerable scatter around the fitted regression line (y = 450,149x + 1.747×10¹⁰), particularly at lower X values where Y ranges widely from roughly $21B to $43B.
2. Strength, Direction, and Statistical Confidence
The correlation coefficient (r = 0.633) indicates a moderate positive linear relationship, with r² = 0.400 meaning only 40% of the variance in BTC price is statistically associated with equity volume — leaving 60% unexplained by this single variable. The 95% CI [0.552, 0.702] is reasonably tight and excludes zero, and the p-value of ~0 confirms this correlation is highly unlikely to be due to chance in this sample. However, the Granger causality tests are critical here: neither direction shows significance (X→Y: p=0.532; Y→X: p=0.551), meaning neither variable helps predict future values of the other once past values of each series are accounted for. This is an important distinction — the contemporaneous correlation is real, but there's no evidence of a lead-lag predictive relationship in either direction at the tested lag structure (10 periods).
3. Notable Patterns and Outliers
Several data points stand out: observations like (20468.81, 43.27B) and (21237.69, 39.24B) show unusually high Y values for relatively low X, suggesting a cluster of days where BTC price spiked independent of equity volume — likely corresponding to early-2022 volatility before the broader market decline. Conversely, points like (36445.31, 51.21B) and (38730.63, 48.02B) show high X paired with high Y, consistent with the general trend. The data appears to cluster into at least two regimes: a lower-X/lower-Y cluster (X < 25000, Y clustered near 22-27B) and a higher-X cluster with more dispersed Y values (30-50B), hinting at possible non-linearity or a regime shift partway through the year (2022 was marked by a sustained crypto bear market alongside equity volatility).
4. Confounding Factors and Caveats
This correlation is almost certainly confounded by shared macroeconomic drivers rather than reflecting a direct causal link. 2022 was dominated by Fed rate hikes, inflation concerns, and risk-off sentiment that simultaneously affected both equity trading activity and crypto valuations — a classic case of a common underlying cause (macro risk sentiment/liquidity conditions) rather than one market driving the other. Additionally, comparing a volume metric (X) to a price level metric (Y) is somewhat unusual — price and volume have different statistical properties (price is more of a random walk, while volume tends to mean-revert), which can produce spurious correlations, especially in trending markets. The mismatched N (3,212 population) vs n (251 sample) also warrants scrutiny — understanding the sampling method (e.g., every-nth-day subsetting) is important to rule out selection bias.
5. Suggestions for Further Investigation
Given the lack of Granger causality, this relationship should not be used for predictive trading signals in either direction. Instead, analysts should: (1) test both series for stationarity and consider differencing or using returns/percentage changes rather than levels, which often reveals different (and sometimes stronger or non-existent) relationships; (2) introduce a common macro control variable (e.g., VIX, DXY, or Fed funds rate) to test whether the correlation collapses once shared drivers are accounted for; (3) segment the year into sub-periods (bull vs. bear phases) to check for regime-dependent correlation strength, since 2022 had distinct market phases; and (4) explore non-linear or threshold models, as the clustering pattern suggests the relationship may not be uniformly linear across the full X range.
X dataset: CryptoDataDownload – Binance BTC/USDT Daily OHLCV
Y dataset: Cboe U.S. Equities Historical Market Volume Data 2022
Part of experiment: Bitcoin - CryptoDataDownload – Binance BTC/USDT Daily OHLCV vs Cboe U.S. Equities Historical Market Volume Data 2022