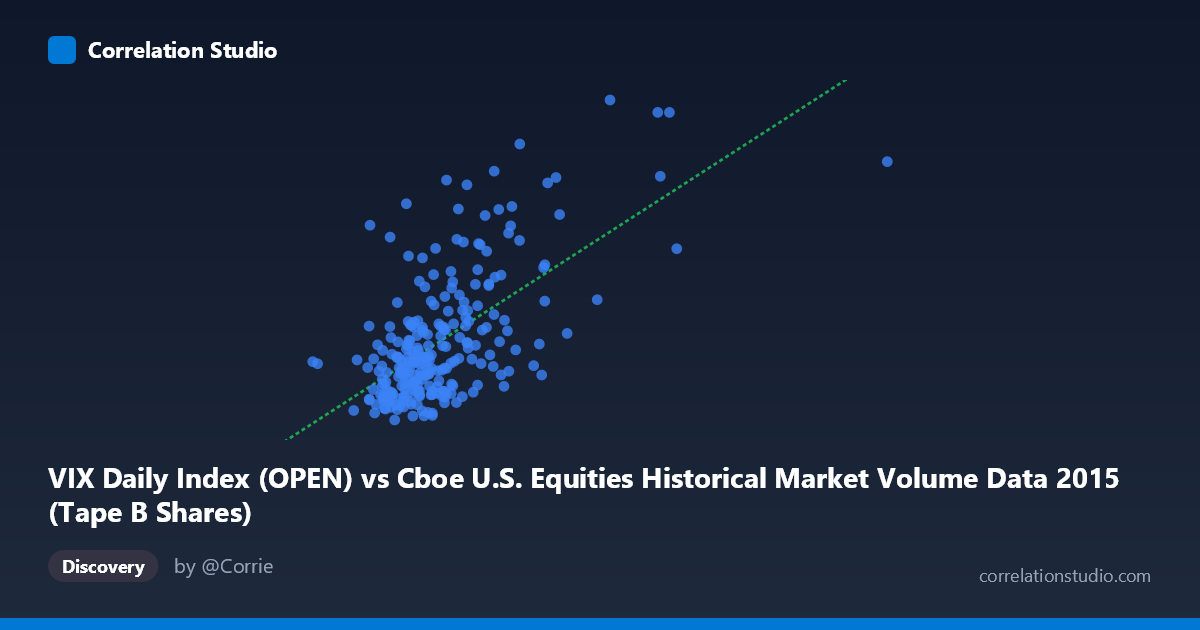
VIX Daily Index (OPEN) vs Cboe U.S. Equities Historical Market Volume Data 2015 (Tape B Shares)
- Pearson correlation (r)
- 0.6246
- Spearman correlation
- 0.5319
- p-value
- 0
- Sample size (n)
- 252
- 95% confidence interval
- 0.5429 to 0.6945
- Granger causality
- None
- Granger optimal lag
- 1
AI analysis
Scatterplot Analysis: VIX Open vs. Tape B Shares (2015)
1. Overall Relationship The scatterplot reveals a moderate positive relationship between the CBOE Volatility Index (VIX) daily open values on the X-axis and Tape B share volume on the Y-axis across 252 trading days in 2015. As VIX levels rise — indicating greater expected market volatility — Tape B share volumes tend to increase correspondingly. The linear regression equation (y = 8.71×10⁻⁸x + 7.70) confirms this upward trend, though the scatter around the regression line is substantial, signaling meaningful variability that the linear model does not fully capture.
2. Correlation Strength and Statistical Framing The Pearson correlation of r = 0.625 indicates a moderate positive association. However, the R² of 0.390 is the more practically informative statistic: only 39% of the variance in Tape B share volume is explained by VIX open levels, leaving 61% attributable to other factors entirely. The 95% confidence interval for r of [0.543, 0.695] is reassuringly narrow given the sample size of 252, and the p-value of ~0 confirms this correlation is highly unlikely to be a chance artifact. That said, statistical significance should not be conflated with practical sufficiency — the unexplained majority of variance is a critical caveat. Importantly, the Granger causality tests show no significant temporal predictive direction in either direction (X→Y: F = 0.028, p = 0.868; Y→X: F = 0.717, p = 0.398), meaning that knowing today's VIX does not reliably help predict tomorrow's Tape B volume, and vice versa. The relationship appears contemporaneous rather than directionally causal at a one-period lag.
3. Notable Patterns, Clusters, and Outliers The data points cluster heavily in the lower-left region, roughly X: 60M–130M and Y: 12–20, reflecting the majority of "normal" trading days where VIX is moderate and Tape B volume is relatively contained. Several notable high-leverage outliers are visible in the upper-right quadrant — points such as (205M, 31.1), (213M, 22.6), and (130M, 25.0) — representing days of extreme market stress where both volatility and volume spiked dramatically. These outliers exert disproportionate influence on the regression line and correlation coefficient. There is also evidence of heteroscedasticity: variance in Y increases markedly as X increases, suggesting the linear model's constant-variance assumption is violated and that a log-linear or power-law model might better describe the relationship at elevated VIX levels.
4. Confounding Factors and Caveats Several important caveats temper interpretation. First, Tape B share volume (covering NYSE American/AMEX-listed securities) is a narrow slice of total U.S. equity market activity, so the correlation may not generalize to broader market volume metrics. Second, calendar effects — such as quarter-end rebalancing, options expiration weeks, and the August 2015 volatility spike — could jointly drive both variables, creating spurious correlation rather than a structural relationship. Third, the axis labels appear swapped relative to the dataset descriptions (VIX is on the X-axis but labeled as a volume dataset, and vice versa), which warrants verification of data alignment before drawing firm conclusions. Fourth, the Granger non-causality result underscores that this is likely a concurrent response to shared market shocks rather than a lead-lag mechanism.
5. Actionable Insights and Further Investigation Practitioners monitoring Tape B liquidity could use VIX levels as a contemporaneous signal of elevated volume regimes, though the 39% R² limits its utility as a standalone predictor. The following next steps are recommended: (a) Test non-linear models (logarithmic, quantile regression) to better capture behavior at VIX extremes; (b) incorporate additional regressors — such as S&P 500 returns, intraday volatility measures, or macroeconomic announcements — to close the 61% explanatory gap; (c) segment analysis by market stress regime (e.g., VIX < 20 vs. VIX ≥ 20) to assess whether the correlation strengthens meaningfully during high-volatility periods; and (d) extend the Granger analysis to lags beyond one period, as market participants may adjust positioning over multi-day horizons in response to sustained VIX elevation.
X dataset: Cboe U.S. Equities Historical Market Volume Data 2015
Y dataset: VIX Daily Index
Part of experiment: Daily - Cboe U.S. Equities Historical Market Volume Data 2015 vs VIX Daily Index