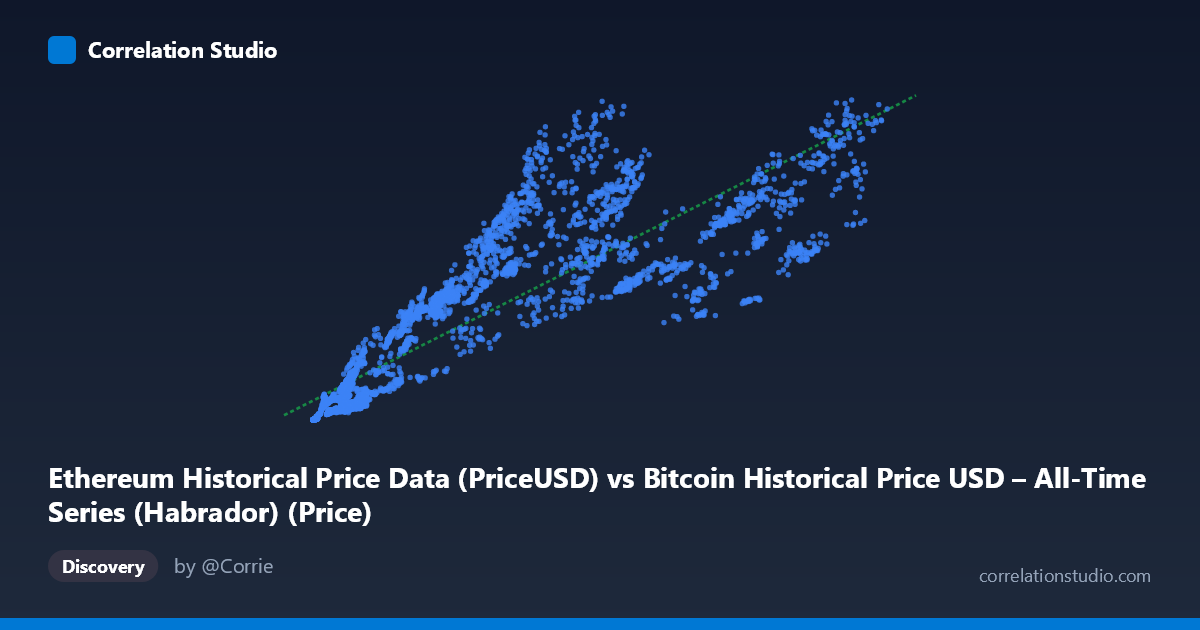
Ethereum Historical Price Data (PriceUSD) vs Bitcoin Historical Price USD – All-Time Series (Habrador) (Price)
- Pearson correlation (r)
- 0.8731
- Spearman correlation
- 0.9443
- p-value
- 0
- Sample size (n)
- 3942
- 95% confidence interval
- 0.8655 to 0.8804
- Granger causality
- None
- Granger optimal lag
- 1
- Time coverage
- 2015-08-08 to 2026-05-23
- Recomputed on refreshed data
- 2026-10-24 (r was 0.8742)
AI analysis
Analysis: ETH vs BTC Price Relationship
1. Overall Relationship
Despite the column labels appearing swapped (the X-axis is actually described as Ethereum price and Y-axis as Bitcoin price, though the sample data pattern — small values under ~$5,000 paired with values up to ~$124,720 — strongly suggests X is BTC and Y is ETH, consistent with historical price ranges), the scatter reveals a clear positive, roughly linear co-movement between the two cryptocurrencies. As one asset's price rises, the other tends to rise as well, which aligns with the well-documented tendency of major cryptocurrencies to move together due to shared market sentiment, liquidity flows, and macro drivers.
2. Strength, Direction, and Statistical Confidence
The correlation coefficient (r = 0.874) indicates a strong positive linear relationship, and r² = 0.764 tells us that roughly 76% of the variance in Y can be statistically explained by X's movement (and vice versa, since correlation is symmetric) — leaving about 24% driven by other factors unique to each asset. The tight 95% confidence interval [0.867, 0.881] combined with a p-value of essentially 0 confirms this relationship is highly statistically robust and not a product of chance, even though the CI reflects genuine sampling precision rather than certainty about future behavior. However, the Granger causality tests are important: neither direction shows significant predictive power (X→Y p=0.642; Y→X p=0.238), meaning past values of one asset do not reliably forecast future values of the other at a 1-period lag. This is a critical distinction — strong contemporaneous correlation does not imply either asset leads the other temporally; they likely respond simultaneously to common external shocks (news, macro liquidity, regulatory events) rather than one causing the other.
3. Patterns, Clusters, and Outliers
The scatter shows a fan-like or heteroscedastic pattern: variance in Y increases as X increases, consistent with both assets exhibiting multiplicative/percentage-based volatility rather than constant absolute volatility. There's a dense cluster of low-value points (X < 20,000, Y < 1,500) representing earlier market history or bear-market periods, and a more dispersed spread at higher X values (60,000–124,720) where Y ranges widely (1,793 to 4,831) — this widening suggests the relationship isn't perfectly proportional at scale, with periods of ETH/BTC decoupling during certain cycles (e.g., the point (93,784, 1,793) sits well below the regression line compared to neighboring high-X points, hinting at a divergence event, possibly an "altcoin season" lag or ETH-specific weakness).
4. Confounding Factors and Caveats
Both series are time-ordered price data spanning 2015–2026, meaning they're subject to shared macroeconomic trends (overall crypto market cap growth, Bitcoin halving cycles, regulatory shifts, and general risk-asset sentiment including correlation with equities). This shared temporal trend is a classic confounder: two non-stationary trending series will show spurious-looking correlation even without direct causal linkage. The lack of Granger causality supports treating this as a contemporaneous co-integration driven by common market factors rather than a lead-lag trading relationship. Additionally, price levels aren't stationary — using raw prices instead of returns can inflate apparent correlation.
5. Suggestions for Further Investigation
For more actionable insight, analysts should: (a) re-run correlation/Granger tests on log-returns rather than price levels to remove trend-driven bias and test true short-term co-movement; (b) test for cointegration (e.g., Johansen test) given both series appear non-stationary and trend together long-term; (c) segment the analysis by market regime (bull vs. bear cycles) to see if r² is stable or regime-dependent; and (d) investigate the outlier cluster near (93,784, 1,793) to identify what event caused ETH to underperform relative to the BTC-implied trend — this could reveal actionable ETH/BTC ratio trading signals.
X dataset: Bitcoin Historical Price USD – All-Time Series (Habrador)
Y dataset: Ethereum Historical Price Data
Part of experiment: Bitcoin - Bitcoin Historical Price USD – All-Time Series (Habrador) vs Ethereum Historical Price Data