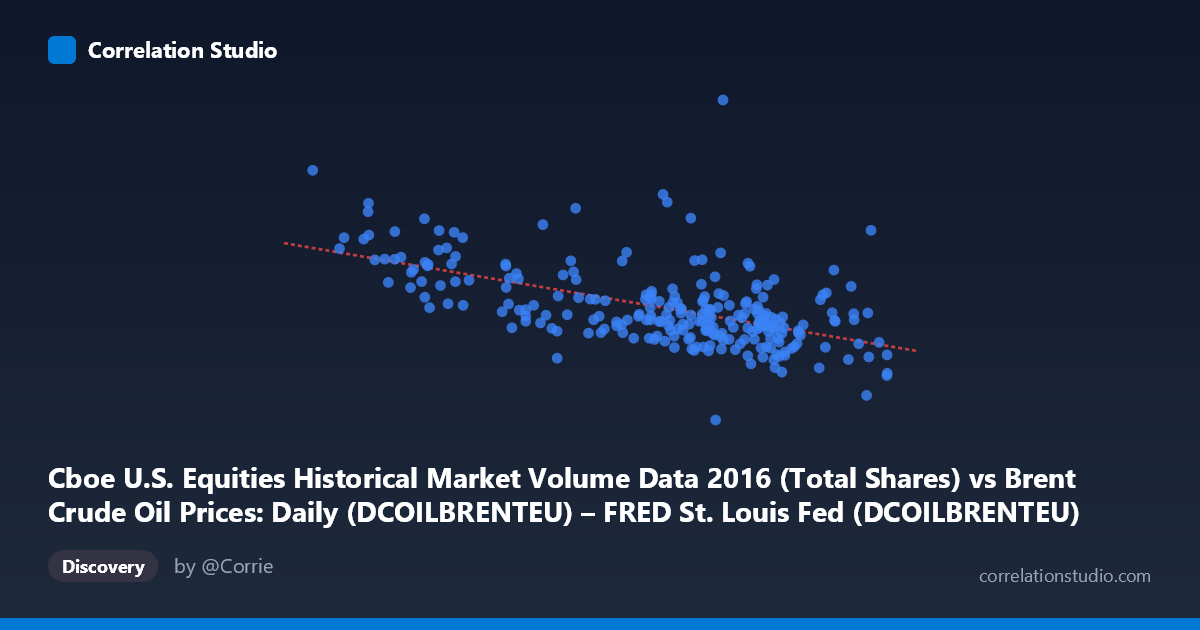
Cboe U.S. Equities Historical Market Volume Data 2016 (Total Shares) vs Brent Crude Oil Prices: Daily (DCOILBRENTEU) – FRED St. Louis Fed (DCOILBRENTEU)
- Pearson correlation (r)
- -0.5667
- Spearman correlation
- -0.5491
- p-value
- 0
- Sample size (n)
- 251
- 95% confidence interval
- -0.6453 to -0.4763
- Granger causality
- None
- Granger optimal lag
- 10
AI analysis
Analysis: Brent Crude Oil Price vs. U.S. Equity Market Volume (2016)
Relationship Overview
The scatterplot reveals a moderate negative relationship between Brent Crude Oil prices (X-axis, USD/barrel) and U.S. equity market trading volume (Y-axis, total shares traded) across 251 trading days in 2016. The linear regression equation (y = -9,426,150x + 925,078,000) indicates that for each $1 increase in Brent crude price, total equity market volume decreases by approximately 9.4 million shares. Visually, this manifests as a downward-sloping cloud of points, with lower crude prices (roughly $26–$35/barrel) associated with substantially higher trading volumes, while higher crude prices ($48–$55/barrel) cluster around lower, more compressed volume levels.
Correlation Strength and Statistical Significance
The correlation coefficient of r = -0.567 reflects a moderate negative association, but the more telling metric is r² = 0.321 — meaning only about 32% of the variance in equity trading volume is explained by crude oil prices. While statistically highly significant (p ≈ 0, N = 3,622), roughly 68% of volume variability remains unexplained by this single variable. The 95% confidence interval of [-0.645, -0.476] is reasonably tight and entirely negative, confirming the inverse direction with confidence. Critically, however, the Granger causality tests show no significant predictive directionality in either direction (X→Y: F = 0.795, p = 0.634; Y→X: F = 0.553, p = 0.851), even at an optimal lag of 10 periods. This means that while a contemporaneous statistical association exists, neither variable reliably forecasts the other temporally — an important caution against any causal or predictive trading interpretation.
Notable Patterns, Clusters, and Outliers
Several features stand out in the data. There is a distinct high-volume cluster at low crude prices (X ≈ $26–$36), where volume observations frequently exceed 600–900 million shares, including a notable outlier near ($26, $896M) and another near ($28, $708M). These likely correspond to early 2016 market turbulence, when crude oil hit multi-year lows and equity market volatility — and thus trading activity — surged dramatically. By contrast, the bulk of observations cluster tightly in the $40–$55 crude range, with volumes concentrated between roughly 380–580 million shares, showing considerably less dispersion. This asymmetry suggests the relationship may be non-linear or regime-dependent, with the strong negative signal driven primarily by extreme low-price observations rather than a uniform linear effect across the full range.
Confounding Factors and Interpretive Caveats
The observed correlation likely reflects a shared underlying driver — market volatility and risk sentiment — rather than a direct causal mechanism between crude prices and equity volume. Early 2016 was characterized by broad financial market stress (China slowdown fears, commodity collapse), which simultaneously depressed crude prices and elevated equity trading activity through panic selling and forced repositioning. This common-factor confounding is a significant interpretive hazard. Additionally, the axes appear to be swapped relative to the variable descriptions in the metadata (the column labels suggest crude price may be on Y and volume on X), which warrants verification before drawing firm conclusions. Seasonal patterns, Federal Reserve policy shifts, and USD strength in 2016 are also plausible confounders. The sample covers only a single calendar year, limiting generalizability.
Actionable Insights and Further Investigation
Given these findings, several avenues merit further exploration. First, incorporating a volatility index (VIX) as a covariate would help disentangle whether the crude-volume relationship is genuinely direct or fully mediated by market stress. Second, segmenting the data into Q1 2016 (low-crude, high-volatility regime) vs. Q2–Q4 would test whether the correlation persists outside the extreme early-year period or collapses — a critical robustness check. Third, testing non-linear specifications (e.g., piecewise regression with a breakpoint around $40/barrel) may better capture the apparent threshold behavior visible in the scatterplot. Finally, extending the analysis across multiple years (2014–2020) would determine whether 2016's relationship is structurally persistent or an artifact of an unusually turbulent commodity cycle.
X dataset: Brent Crude Oil Prices: Daily (DCOILBRENTEU) – FRED St. Louis Fed
Y dataset: Cboe U.S. Equities Historical Market Volume Data 2016
Part of experiment: Daily - Brent Crude Oil Prices: Daily (DCOILBRENTEU) – FRED St. Louis Fed vs Cboe U.S. Equities Historical Market Volume Data 2016