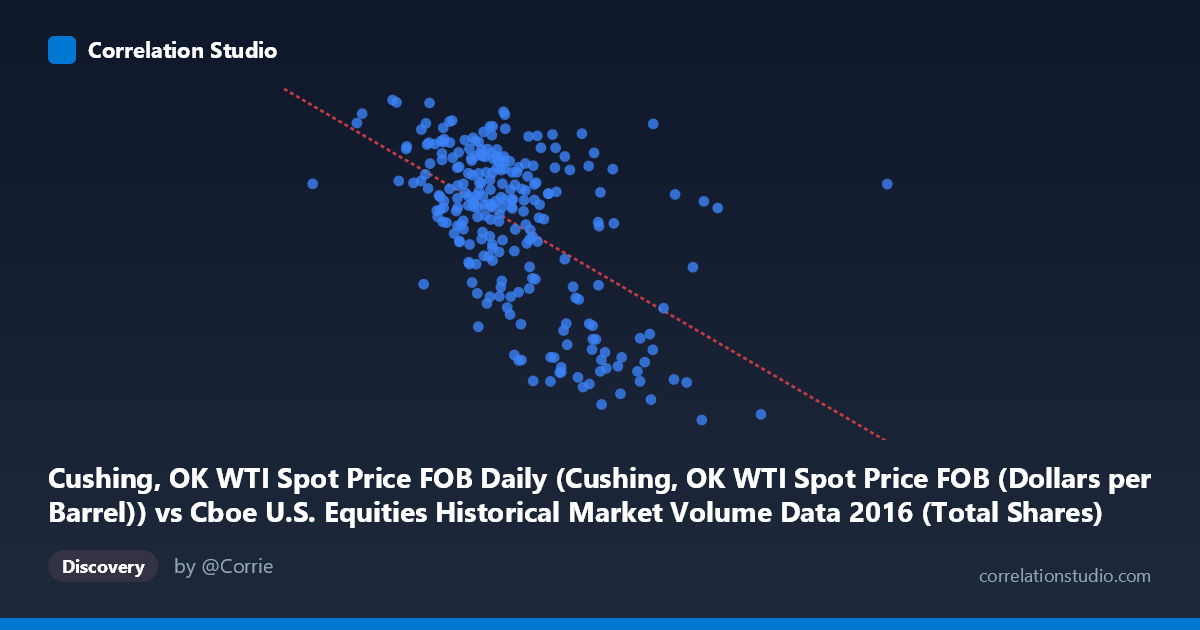
Cushing, OK WTI Spot Price FOB Daily (Cushing, OK WTI Spot Price FOB (Dollars per Barrel)) vs Cboe U.S. Equities Historical Market Volume Data 2016 (Total Shares)
- Pearson correlation (r)
- -0.5422
- Spearman correlation
- -0.4964
- p-value
- 0
- Sample size (n)
- 252
- 95% confidence interval
- -0.624 to -0.4487
- Granger causality
- None
- Granger optimal lag
- 1
AI analysis
Analysis: WTI Crude Oil Prices vs. Cboe U.S. Equities Market Volume (2016)
Relationship Overview
The scatterplot reveals a negative relationship between WTI crude oil spot prices (X-axis) and total U.S. equities market share volume (Y-axis) across 252 trading days in 2016. As oil prices rise, equity market trading volume tends to decline, and vice versa. The linear regression equation (y = -3.27×10⁻⁸x + 60.08) reflects this inverse slope, suggesting that for every dollar increase in WTI prices, total market share volume decreases by a modest but consistent amount. Visually, the scatter likely shows a downward-trending cloud with considerable dispersion, indicating a real but far from deterministic relationship between these two market variables.
Correlation Strength and Statistical Significance
The Pearson correlation of r = -0.542 indicates a moderate negative association. However, the coefficient of determination (R² = 0.294) tells a more sobering story: only 29.4% of the variance in equities trading volume is explained by oil price movements, leaving over 70% attributable to other factors. The 95% confidence interval for r of [-0.624, -0.449] is relatively tight and does not include zero, and the p-value of effectively 0 confirms this correlation is highly statistically significant given the population of N = 3,622 observations. That said, statistical significance here is partly a function of large sample size — the effect, while real, is moderate in practical terms. Critically, Granger causality tests find no significant predictive directionality in either direction (X→Y: F = 0.705, p = 0.402; Y→X: F = 0.893, p = 0.346), meaning that past oil prices do not reliably forecast future trading volume and vice versa at the tested lag. This rules out simple temporal lead-lag exploitation for trading strategies.
Notable Patterns and Outliers
Several features in the sample points merit attention. There are apparent outliers at high X values with very low Y values — for instance, points near (708M, 29.55) and (634M, 32-33) suggest that at elevated oil price levels, volume compression is particularly pronounced. Conversely, lower oil price readings (e.g., around 333M–400M range) cluster with higher volume values (46–51 range), reinforcing the inverse trend. There also appears to be a non-linear character to the relationship: volume seems to compress more sharply at the high and low extremes of oil prices rather than declining uniformly, suggesting a potential threshold or regime effect rather than a purely linear response. The relatively wide vertical scatter at mid-range X values (450M–550M) implies high residual variance where oil price alone is a weak predictor.
Confounding Factors and Caveats
Several important caveats apply. First, 2016 was an unusual year for both oil markets and equities — WTI crude recovered from multi-year lows (~$26/barrel in February) to above $50 by year-end, coinciding with OPEC production negotiations and the U.S. presidential election, all of which independently drove equity volume. This means the correlation may be spuriously driven by a shared third factor (macro risk sentiment, the election cycle, or Federal Reserve policy) rather than any direct causal link between oil prices and trading activity. Second, high-volume days often reflect market stress or uncertainty events that are independently triggered, so the axis labels — noting that X and Y dataset assignments appear swapped in the hints — should be carefully verified to ensure directional interpretation is correct. Third, aggregated total market share volume is a very broad measure, conflating vastly different sectors with varying oil price sensitivities.
Actionable Insights and Further Investigation
Given the moderate correlation without Granger causality, practitioners should avoid using oil prices as a direct timing signal for equity volume strategies. However, the relationship warrants deeper sector-level analysis — decomposing total volume into energy sector vs. non-energy volumes could reveal whether the aggregate signal masks a stronger relationship in oil-sensitive equities. It would be valuable to test non-linear models (e.g., piecewise regression or LOESS smoothing) to capture potential threshold effects observed at price extremes. Additionally, introducing control variables such as the VIX volatility index, Fed announcement days, or OPEC meeting dates as dummy variables in a multivariate regression could substantially improve explanatory power beyond the current 29.4% R². Finally, extending the analysis beyond 2016 across multiple market cycles would help distinguish whether this correlation is a stable structural feature or a transient artifact of 2016's specific macro environment.
X dataset: Cboe U.S. Equities Historical Market Volume Data 2016
Y dataset: Cushing, OK WTI Spot Price FOB Daily
Part of experiment: Daily - Cboe U.S. Equities Historical Market Volume Data 2016 vs Cushing, OK WTI Spot Price FOB Daily