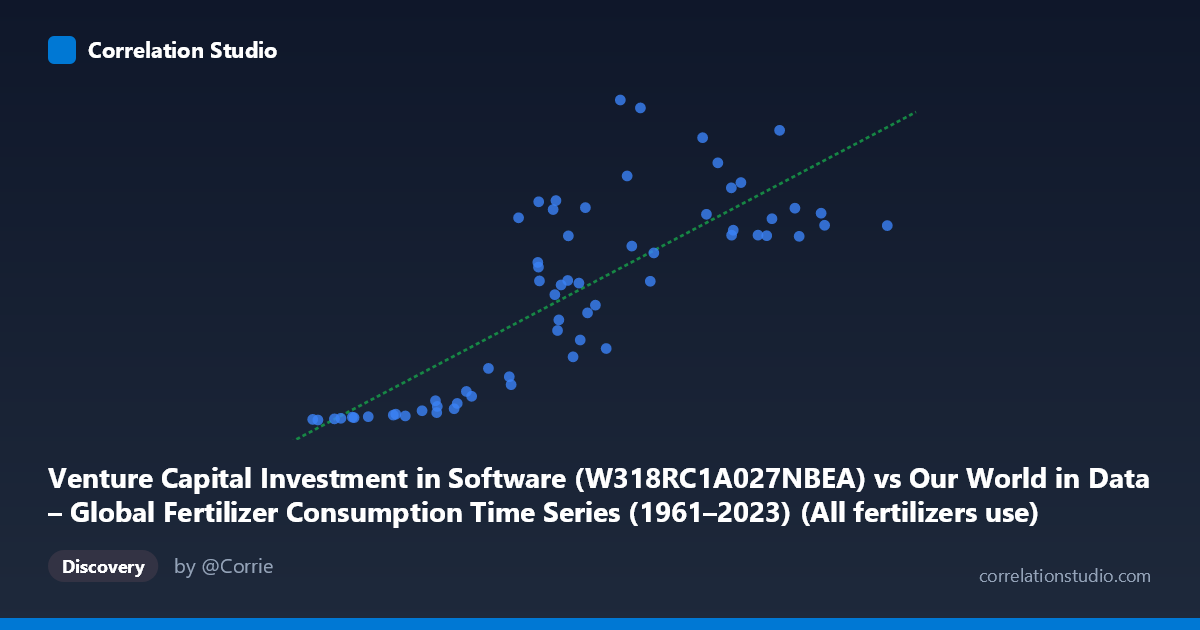
Venture Capital Investment in Software (W318RC1A027NBEA) vs Our World in Data – Global Fertilizer Consumption Time Series (1961–2023) (All fertilizers use)
- Pearson correlation (r)
- 0.8023
- Spearman correlation
- 0.8118
- p-value
- 0
- Sample size (n)
- 63
- 95% confidence interval
- 0.6922 to 0.876
- Granger causality
- None
- Granger optimal lag
- 10
- Time coverage
- 1961-01-01 to 2023-01-01
- Recomputed on refreshed data
- 2026-10-24 (r was 0.8023)
AI analysis
Scatterplot Analysis: Venture Capital Software Investment vs. Global Fertilizer Consumption
Relationship Overview
The scatterplot reveals a positive, moderately strong association between Venture Capital Investment in Software (X-axis) and Global Fertilizer Consumption (Y-axis) spanning 1961–2023. As VC software investment increases from roughly $3.2M to $22.7M, fertilizer consumption rises from near-zero baseline levels (~7 kg/ha equivalent) to peaks exceeding 460 units. The linear regression equation (y = 2.2241×10⁻⁵x − 78.63) captures a general upward trend, but the scatter around this line — particularly at mid-range X values — suggests the relationship is not uniformly linear throughout the full range. The data points cluster noticeably at the lower-left end and spread more diffusely at higher X values, hinting at a possible curvilinear or segmented structure underlying the apparent linearity.
Correlation Strength and Statistical Interpretation
The Pearson correlation of r = 0.8023 indicates a strong positive linear association, and the R² of 0.6437 means approximately 64.4% of the variance in fertilizer consumption is statistically explained by VC software investment within this sample. The remaining ~36% is attributable to other factors not captured by this model. The 95% confidence interval [0.692, 0.876] is relatively narrow and lies entirely above zero, reinforcing confidence that this association is robustly positive in the population. The p-value of 2.67×10⁻¹⁵ is extraordinarily small (far below α = 0.05), meaning this correlation is statistically significant at any conventional threshold — the probability of observing a correlation this strong by chance under the null hypothesis is essentially negligible. However, the Granger causality analysis tells a critical story: neither direction (X→Y nor Y→X) achieves statistical significance at the optimal 10-period lag (F = 1.70, p = 0.125 for X→Y; F = 1.13, p = 0.368 for Y→X). This means that neither variable temporally predicts the other beyond what each predicts of itself — a major red flag for any causal interpretation.
Notable Patterns, Clusters, and Outliers
Several structural features stand out. First, there is a dense cluster of low-value points at the lower left (X < ~6M, Y < ~40), corresponding to the early decades (1960s–1970s) when both VC software investment and fertilizer consumption were in nascent stages globally. Second, the mid-range zone (X: 10M–14M) shows substantial vertical scatter, with Y values ranging from ~100 to over 460 — this dispersion suggests the linear model fits poorly in this region and that other time-varying factors are driving fertilizer consumption independently of VC investment levels. Third, point (13,645,327, 466.42) stands out as a potential high-leverage outlier with an unusually high Y value relative to its X position, as does (14,330,675, 455.02), both sitting well above the regression line. The upper-right cluster (X 17M) appears more tightly grouped around the regression line, suggesting better model fit in recent decades.
Confounding Factors and Critical Caveats
This correlation is almost certainly a classic case of spurious correlation driven by shared temporal trends — both variables happen to increase over the same 1961–2023 timeframe due to independent global processes: the Green Revolution and agricultural intensification driving fertilizer use, and the technology industry's exponential growth driving VC investment. These are mechanistically unrelated phenomena from entirely different sectors of the economy. The dataset descriptions themselves appear mislabeled or swapped (the X-axis column is attributed to an "Our World in Data Fertilizer" dataset but labeled as VC investment, and vice versa), which raises data provenance concerns. Additionally, both series likely exhibit strong autocorrelation, inflating the apparent correlation and rendering standard p-values overly optimistic. The Granger causality null result — despite the high r — is precisely what one would expect from two independently trending time series with no genuine predictive link.
Actionable Insights and Further Investigation
Given the absence of Granger causality and the likely spurious nature of this correlation, no policy or investment decisions should be based on this relationship. For rigorous analysis, the next steps should include: (1) first-differencing or detrending both series to remove shared secular trends before computing correlation; (2) cointegration testing (e.g., Engle-Granger or Johansen) to distinguish genuine long-run relationships from coincidental parallel trends; (3) controlling for time as an explicit covariate in regression to isolate any residual relationship; and (4) verifying data labeling to ensure the correct variables are mapped to each axis. If the goal is to understand fertilizer consumption drivers, more theoretically grounded predictors — crop prices, population growth, arable land expansion, and subsidy policies — would yield far more meaningful and interpretable models.
X dataset: Our World in Data – Global Fertilizer Consumption Time Series (1961–2023)
Y dataset: Venture Capital Investment in Software
Part of experiment: Yearly - Our World in Data – Global Fertilizer Consumption Time Series (1961–2023) vs Venture Capital Investment in Software