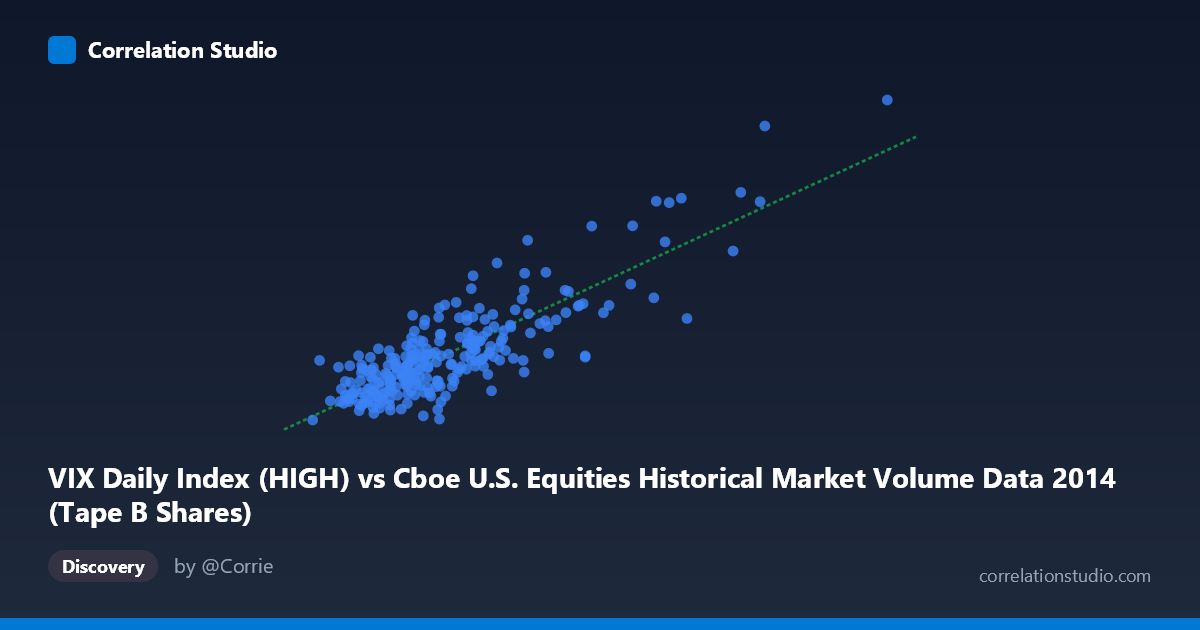
VIX Daily Index (HIGH) vs Cboe U.S. Equities Historical Market Volume Data 2014 (Tape B Shares)
- Pearson correlation (r)
- 0.8392
- Spearman correlation
- 0.7479
- p-value
- 0
- Sample size (n)
- 252
- 95% confidence interval
- 0.7984 to 0.8723
- Granger causality
- None
- Granger optimal lag
- 1
AI analysis
Scatterplot Analysis: VIX Daily Index (HIGH) vs. Tape B Shares (2014)
Relationship Overview The scatterplot reveals a notably strong positive relationship between the VIX Daily Index High values and Tape B share volume across U.S. equities exchanges throughout 2014. As the VIX High increases, Tape B share volume rises in a broadly linear fashion, consistent with the regression equation y = 1.07×10⁻⁷x + 6.90. This makes intuitive sense: elevated VIX readings signal heightened market fear and uncertainty, which historically coincides with surging trading activity as investors reposition, hedge, or liquidate holdings. The data spans the full 2014 calendar year (January through December), capturing several notable volatility episodes including geopolitical tensions and the October 2014 equity selloff.
Correlation Strength and Statistical Significance The Pearson correlation of r = 0.839 is strong, and the coefficient of determination r² = 0.704 indicates that approximately 70.4% of the variance in Tape B share volume is explained by the VIX High level — a practically meaningful result. The 95% confidence interval of [0.798, 0.872] is relatively tight and lies entirely well above zero, reinforcing confidence in the estimate. With a p-value of effectively zero across a paired sample of n = 252 drawn from a population of N = 3,686 observations, the association is overwhelmingly statistically significant. However, Granger causality tests find no significant predictive temporal direction in either direction (X→Y: F = 0.065, p = 0.799; Y→X: F = 0.077, p = 0.782). This is an important nuance: while the two variables are strongly correlated contemporaneously, neither reliably leads the other at a one-period lag, suggesting they respond simultaneously to common driving forces rather than one causing the other sequentially.
Patterns, Clusters, and Outliers The scatterplot exhibits a relatively tight linear core for VIX High values roughly between 38M and 90M (X-axis), where Y values cluster between approximately 11 and 17 — this dense central mass represents the majority of 2014 trading days during calmer market conditions. Beyond approximately X = 110M, the relationship becomes more dispersed but maintains its upward trajectory, with several prominent outliers in the upper-right quadrant (e.g., points near X = 155–162M with Y values of 25–29) corresponding to specific high-volatility events. These extreme observations disproportionately drive the regression slope and warrant scrutiny. There is no strong evidence of non-linearity within the bulk of the data, though the upper tail suggests possible heteroscedasticity — variance in Y appears to increase at higher X values.
Confounding Factors and Caveats Several important caveats apply. First, both variables may be jointly driven by exogenous market events (e.g., Federal Reserve announcements, geopolitical shocks, earnings seasons), making the high r² potentially spurious from a causal standpoint. The Granger test's failure to identify directional predictability supports this interpretation. Second, Tape B shares represent only a subset of market volume (NYSE American and regional exchanges), which may not fully represent aggregate market activity and could introduce selection bias. Third, the linear regression assumes homoscedasticity and normality of residuals — the visible clustering and outlier structure suggests these assumptions may be violated. Fourth, the single-year time window (2014) limits generalizability; the correlation structure may differ substantially in other market regimes.
Actionable Insights and Further Investigation Practitioners could use the contemporaneous VIX–volume relationship as a real-time risk signal: unusually high VIX readings may warrant preparation for elevated Tape B volume and associated liquidity and execution impacts. However, given the absence of Granger causality, VIX should not be used as a lagged predictor of next-period volume for trading strategies without further validation. Recommended next steps include: (1) testing the relationship across multiple years to assess regime stability; (2) applying a log transformation to both variables to address potential heteroscedasticity and improve model fit; (3) introducing multivariate controls such as S&P 500 returns, Fed announcement dates, and earnings calendar effects to isolate the independent VIX contribution; and (4) examining whether intraday data reveals a stronger lead-lag structure obscured by daily aggregation.
X dataset: Cboe U.S. Equities Historical Market Volume Data 2014
Y dataset: VIX Daily Index
Part of experiment: Daily - Cboe U.S. Equities Historical Market Volume Data 2014 vs VIX Daily Index