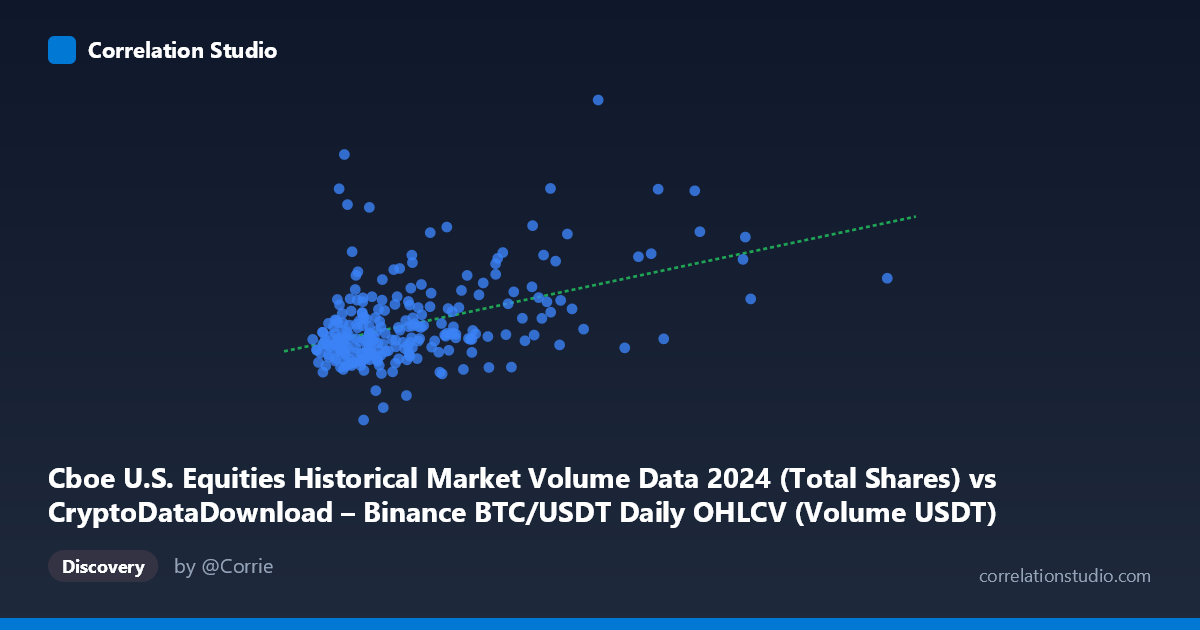
Cboe U.S. Equities Historical Market Volume Data 2024 (Total Shares) vs CryptoDataDownload – Binance BTC/USDT Daily OHLCV (Volume USDT)
- Pearson correlation (r)
- 0.4493
- Spearman correlation
- 0.368
- p-value
- 0
- Sample size (n)
- 252
- 95% confidence interval
- 0.3449 to 0.5428
- Granger causality
- None
- Granger optimal lag
- 10
- Time coverage
- 2024-01-02 to 2024-12-31
AI analysis
Analysis of Volume Relationship: Cboe U.S. Equities vs. Binance BTC/USDT
Note on labeling: The column labels appear swapped relative to the datasets described (X is labeled as Cboe data but described under "CryptoDataDownload," while Y is labeled Binance Volume USDT but attributed to the Cboe dataset). I'll treat X and Y purely as the two numeric series provided, since the statistical relationship is unaffected by the labeling confusion.
1. Overall Relationship
The scatterplot shows a positive but weak-to-moderate association between the two volume series. Most data points cluster tightly in the lower-left region (X roughly 1.0–4.5 billion, Y roughly 500–800 million), with a long right-tail of increasingly sparse, high-X outliers (e.g., points near 5.5B, 6.7B, 8.6B, and the max at 11B) that pull the regression line upward. The bulk of the data shows only mild upward drift in Y as X increases, while a handful of extreme-X observations disproportionately influence the fitted trend.
2. Strength, Direction, and Uncertainty
The correlation coefficient (r = 0.449) indicates a moderate positive linear relationship, but r² = 0.202 tells the more important story: only about 20% of the variance in Y is explained by X, leaving ~80% attributable to other factors or noise. The 95% CI [0.345, 0.543] is reasonably tight and excludes zero, and the p-value (6.3×10⁻¹⁴) confirms this correlation is highly statistically significant — this is a real, non-random association, not a fluke of sampling. However, statistical significance ≠ practical strength: with n=252, even modest correlations become "significant," so this relationship, while real, is not strong enough to be a reliable standalone predictor.
Critically, the Granger causality tests show no significant predictive direction in either direction (X→Y: p=0.79; Y→X: p=0.51) at the optimal lag of 10 periods. This means neither series helps forecast future values of the other beyond what each series' own history provides. The contemporaneous correlation may reflect a shared underlying driver (e.g., general market activity, seasonality, or macro volatility) rather than one variable causing or leading the other.
3. Notable Patterns and Outliers
- Dense core cluster: The majority of points sit in a fairly narrow Y band (500M–800M) across a wide range of lower X values, suggesting Y has a "baseline" volume level largely independent of X in normal conditions. - Right-tail outliers: Points at X ≈ 5.5B, 6.7B, 8.6B, and 11B (max) are sparse but show elevated Y values (682M, 824M, 877M, and presumably higher near the max). These few points exert substantial leverage on both the correlation and regression slope — removing them would likely reduce r² further. - Low-Y anomalies: A few points (e.g., Y=379.7M, 413.3M) sit well below the main cluster at moderate X values, indicating occasional decoupling. - Heteroscedasticity: Variance in Y appears to increase somewhat with X, a classic pattern that can inflate correlation estimates and violate linear regression assumptions.
4. Confounding Factors and Caveats
Both series are volume metrics tied to financial markets in the same 2024 period, so shared macro factors — overall market volatility, risk-on/risk-off sentiment, major news events, quarter-end effects, or even correlated day-of-week/holiday effects — could drive simultaneous spikes in both without direct causal linkage. The mismatch between the stated N (3,212 full population) and n (252 sampled) also means this is a subsample; sampling method (e.g., every-nth-day or random draw) could affect representativeness. Additionally, financial volume data is often log-normally distributed with heavy right skew (evident here from mean median-like clustering and extreme max value 11B vs. mean 2.77B) — a linear model on raw values is likely misspecified.
5. Suggestions for Further Investigation
- Log-transform both variables before correlating/regressing, since volume data is typically log-normal; this would likely produce a more stable and interpretable r². - Test for a common third factor (e.g., an overall market volatility index, VIX, or aggregate trading activity) that might explain co-movement without direct linkage between these two specific series. - Robustness check: Re-run correlation excluding the top 5% of X outliers to see how much they're driving the r² = 0.20 result. - Given the null Granger causality result, do not use one series to forecast the other; instead, treat both as reflecting a shared latent driver, or examine other lag structures/lead-lag windows outside the tested range. - Clarify the axis/dataset labeling discrepancy before drawing domain-specific conclusions about equities vs. crypto volume relationships.
X dataset: CryptoDataDownload – Binance BTC/USDT Daily OHLCV
Y dataset: Cboe U.S. Equities Historical Market Volume Data 2024
Part of experiment: Bitcoin - CryptoDataDownload – Binance BTC/USDT Daily OHLCV vs Cboe U.S. Equities Historical Market Volume Data 2024