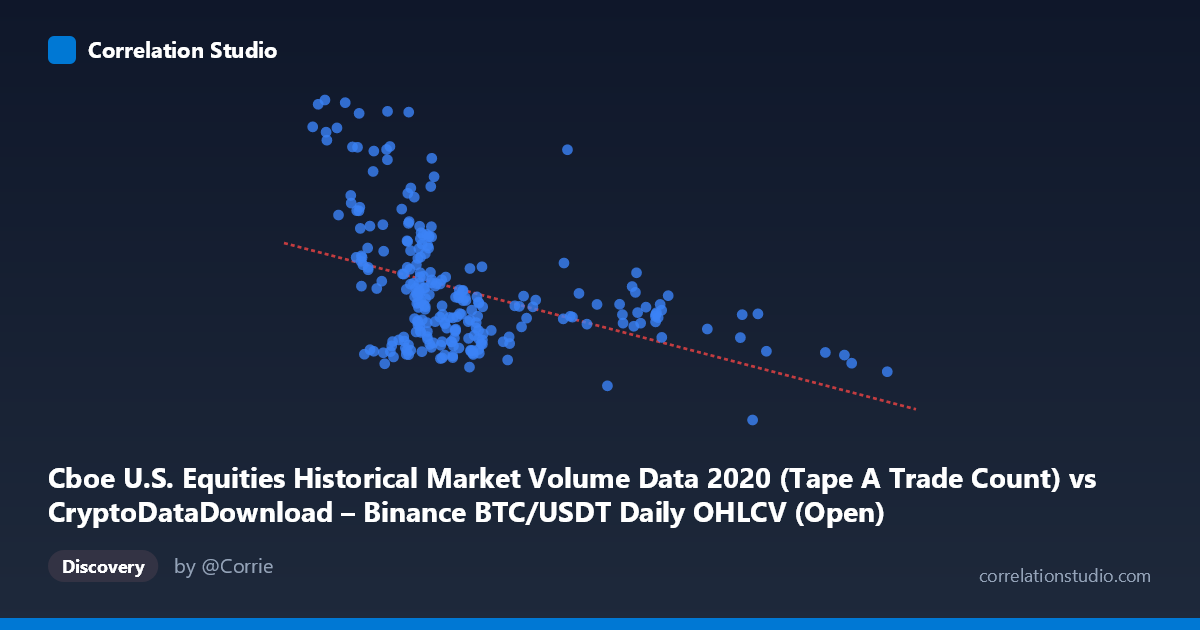
Cboe U.S. Equities Historical Market Volume Data 2020 (Tape A Trade Count) vs CryptoDataDownload – Binance BTC/USDT Daily OHLCV (Open)
- Pearson correlation (r)
- -0.4302
- Spearman correlation
- -0.4688
- p-value
- 0
- Sample size (n)
- 253
- 95% confidence interval
- -0.5257 to -0.3241
- Granger causality
- None
- Granger optimal lag
- 10
- Time coverage
- 2020-01-02 to 2020-12-31
AI analysis
Analysis: Cboe Trade Count vs. BTC/USDT Open Price (2020)
1. Relationship Overview
The scatterplot shows a modest negative linear trend between Cboe U.S. equities trade count and Binance BTC/USDT opening price. Most data points cluster tightly in the X range of 7,000–12,000 trades, with Y values scattered widely between roughly 1,200,000 and 2,000,000. A smaller number of points extend into higher X values (15,000–28,875), and these tend to correspond to lower Y values, which is largely responsible for the negative slope. A handful of high-Y outliers (Y 2,800,000) occur exclusively at low-to-mid X values, adding vertical scatter without altering the overall downward trend.
2. Strength, Direction, and Statistical Meaning
The correlation coefficient (r = -0.430) indicates a weak-to-moderate negative linear relationship. The r² value of 0.185 means only about 18.5% of the variance in Y (BTC opening price) is explained by X (equity trade count) — the remaining ~81.5% is driven by other factors. The 95% CI [-0.526, -0.324] excludes zero and is reasonably narrow, and the p-value (8.0e-13) is highly significant, confirming this negative association is real and not due to chance, given the sample.
However, statistical significance should not be conflated with practical strength: this is a weak relationship in effect-size terms. Critically, the Granger causality tests show no significant predictive direction in either direction (X→Y: p = 0.868; Y→X: p = 0.469). This means that despite the contemporaneous negative correlation, past values of one series do not help forecast future values of the other — the relationship, if causal at all, is not temporal/lagged in nature within the tested lag structure (10 periods).
3. Notable Patterns and Outliers
The data shows a dense core cluster (X: 7,000–12,000) with substantial Y-axis spread, suggesting that within "normal" equity trading volume ranges, BTC price varies for reasons unrelated to X. A secondary, sparser group of points at higher X (17,000–28,875) shows consistently lower Y values (~1,200,000–1,900,000), which pulls the regression line downward and may be disproportionately influential given their leverage (extreme X values with limited replication). Several extreme Y outliers (~2.8–3.3 million) at low X values (4,800–9,800) also stand out — these may correspond to specific high-volatility BTC price spikes in 2020 (e.g., pandemic-related market turmoil in Q1, or year-end rally) rather than genuine covariation with equity trade counts.
4. Confounding Factors and Caveats
Both series are time-ordered financial/market data from 2020, a year marked by major macro shocks (COVID-19 crash, unprecedented stimulus, retail trading boom). Both BTC price and equity trade volume were likely responding to shared macro drivers (volatility regimes, liquidity conditions, retail participation surges) rather than one directly influencing the other. This shared-driver confounding could produce spurious correlation. Additionally, both series may exhibit autocorrelation/trending behavior typical of financial time series, which can inflate apparent correlation between two unrelated trending series (a classic non-stationarity artifact). The lack of Granger causality supports the idea that this is likely a spurious or indirect association rather than a direct causal linkage.
5. Suggestions for Further Investigation
Given the low r² and null Granger causality result, this correlation should not be used for predictive or trading purposes. Recommended next steps: (1) test both series for stationarity (e.g., ADF test) and consider differencing or using returns/growth rates instead of levels, which often removes spurious trend-driven correlation; (2) investigate common exogenous drivers (e.g., VIX, overall market liquidity, COVID-era events) that could jointly explain both series' 2020 behavior; (3) examine the high-X, low-Y cluster separately — determine if these are dates clustered in a specific period (e.g., market recovery/summer 2020) to assess whether it's a regime-dependent relationship rather than a stable linear one; (4) exclude or separately model the extreme Y outliers to check regression sensitivity.
X dataset: CryptoDataDownload – Binance BTC/USDT Daily OHLCV
Y dataset: Cboe U.S. Equities Historical Market Volume Data 2020
Part of experiment: Bitcoin - CryptoDataDownload – Binance BTC/USDT Daily OHLCV vs Cboe U.S. Equities Historical Market Volume Data 2020