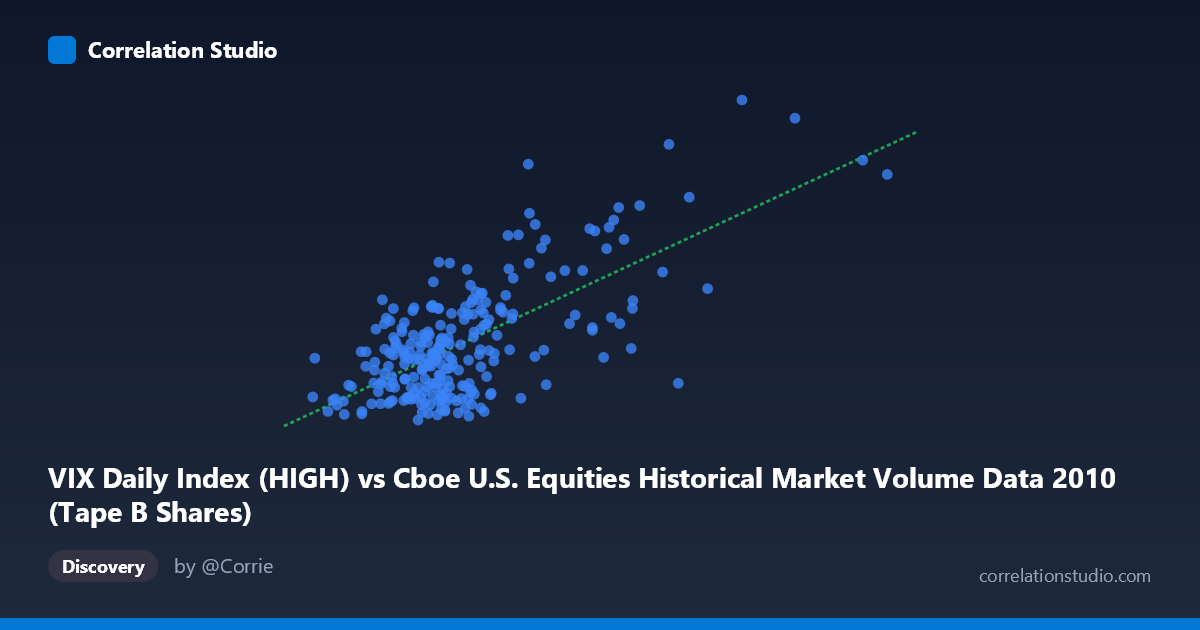
VIX Daily Index (HIGH) vs Cboe U.S. Equities Historical Market Volume Data 2010 (Tape B Shares)
- Pearson correlation (r)
- 0.6831
- Spearman correlation
- 0.5036
- p-value
- 0
- Sample size (n)
- 252
- 95% confidence interval
- 0.6111 to 0.7439
- Granger causality
- Y → X
- Granger optimal lag
- 1
AI analysis
Analysis: VIX Daily Index (HIGH) vs. Tape B Shares Volume (2010)
Relationship Overview The scatterplot reveals a moderately strong positive relationship between Cboe U.S. equity market volume (Tape B shares traded) and the VIX Daily Index high values across 2010. As trading volume on Tape B increases, the VIX high tends to rise correspondingly, following the linear regression equation y = 9.23×10⁻⁸x + 13.27. This is a financially intuitive relationship: elevated trading volume, particularly in exchange-listed equities, tends to co-occur with heightened market uncertainty and volatility. The scatter is visibly wide at higher volume levels, suggesting the relationship is consistent at moderate values but noisier during extreme market activity.
Correlation Strength and Statistical Significance The Pearson correlation of r = 0.683 indicates a moderate-to-strong positive association, and the R² of 0.467 means that roughly 46.7% of the variance in VIX highs is explained by Tape B share volume — a meaningful but incomplete picture, leaving over half the variance unexplained by this single predictor. The 95% confidence interval of [0.611, 0.744] is relatively tight, reflecting strong statistical precision, and the p-value of effectively zero confirms this is not a chance finding across the 252 paired observations drawn from a population of 3,302. Critically, the Granger causality analysis points unidirectionally: Y Granger-causes X (F = 6.96, p = 0.009), meaning past VIX highs have statistically significant predictive power over future Tape B volume, but not vice versa (X→Y: F = 3.58, p = 0.060, falling just short of significance). This temporal directionality suggests that rising volatility expectations tend to precede surges in trading volume, a finding with meaningful implications for market microstructure.
Notable Patterns, Clusters, and Outliers The data exhibits a discernible clustering structure. A dense core of observations sits in the lower-left region (volumes roughly 60–130M shares, VIX 16–26), representing typical low-volatility trading days that dominated much of 2010. A secondary, more dispersed cluster extends into the upper-right, including notable high-volume/high-VIX observations such as (316M shares, VIX 42.15), (255M shares, VIX 48.20), and (218M shares, VIX 43.74) — likely corresponding to stress episodes such as the May 2010 Flash Crash. The point at approximately (255M, 48.2) appears as a potential leverage outlier and may disproportionately influence the regression slope. The relationship also shows signs of heteroscedasticity, with variance in VIX values increasing substantially at higher volume levels, which partially violates linear regression assumptions.
Confounding Factors and Caveats Several important caveats deserve attention. First, Tape B specifically covers NYSE American (AMEX) and regional exchange-listed securities, which may not fully represent broad market activity — using total consolidated volume could alter the relationship. Second, the axis labels appear swapped relative to conventional expectation: VIX is typically the independent variable predicting volume, yet here it is placed on the X-axis while Tape B volume is on Y; the Granger result confirms the causal arrow runs the other way. Third, common drivers — such as macroeconomic news events, Fed announcements, or the Flash Crash — likely simultaneously spike both variables, inflating the correlation without implying a clean causal mechanism. Fourth, the time series nature of daily data introduces autocorrelation, and while Granger causality accounts for lags, standard correlation assumes independence, potentially overstating precision. Finally, the 2010 sample is a single year containing an extraordinary event (Flash Crash), limiting generalizability.
Actionable Insights and Further Investigation The Granger causality finding — that VIX highs predict next-period Tape B volume — is the most actionable result here. Market makers, liquidity providers, and algorithmic traders could incorporate VIX signals as a leading indicator for anticipated volume surges in regional/Tape B securities, adjusting inventory and quoting strategies accordingly with a one-period lag. To deepen understanding, analysts should: (1) test whether this VIX→volume relationship holds across Tape A and Tape C to assess whether it is specific to Tape B or systemic; (2) apply a log transformation to both variables to address heteroscedasticity and potential non-linearity; (3) isolate the Flash Crash period and re-run the analysis to determine whether the correlation holds structurally outside of crisis conditions; and (4) extend the time frame beyond 2010 to test whether the Granger relationship is stable across different volatility regimes, including low-VIX environments like 2017 or high-VIX periods like 2020.
X dataset: Cboe U.S. Equities Historical Market Volume Data 2010
Y dataset: VIX Daily Index
Part of experiment: Daily - Cboe U.S. Equities Historical Market Volume Data 2010 vs VIX Daily Index