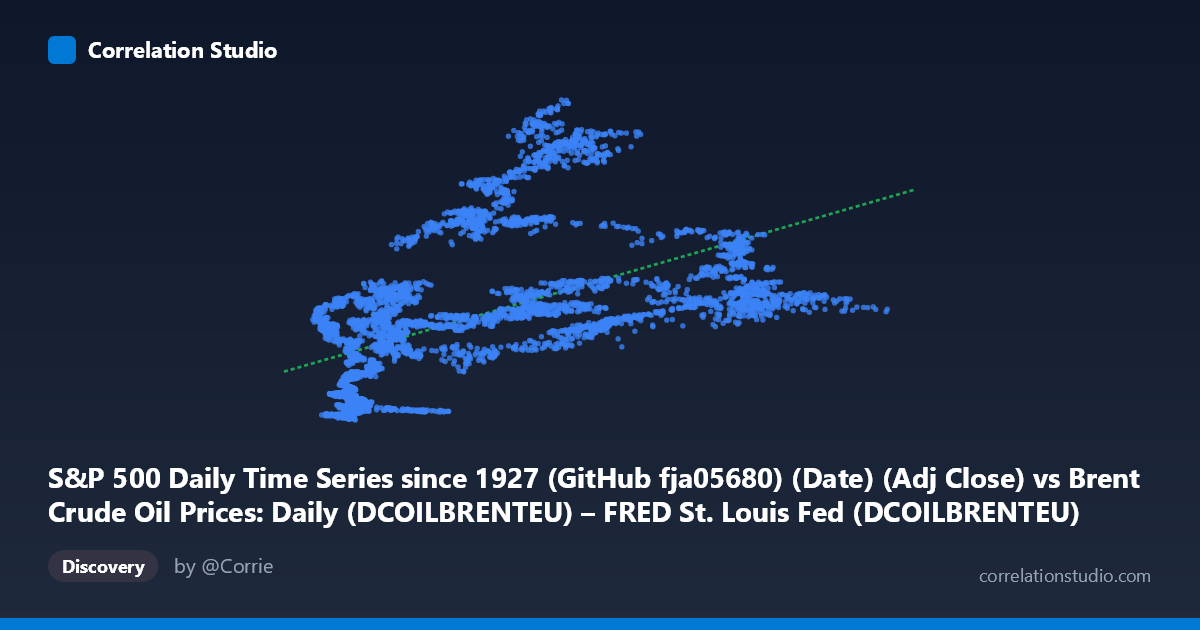
S&P 500 Daily Time Series since 1927 (GitHub fja05680) (Date) (Adj Close) vs Brent Crude Oil Prices: Daily (DCOILBRENTEU) – FRED St. Louis Fed (DCOILBRENTEU)
- Pearson correlation (r)
- 0.5378
- Spearman correlation
- 0.6915
- p-value
- 0
- Sample size (n)
- 8140
- 95% confidence interval
- 0.5221 to 0.553
- Granger causality
- None
- Granger optimal lag
- 1
AI analysis
S&P 500 vs. Brent Crude Oil: Correlation Analysis
1. Overall Relationship The scatterplot reveals a positive but highly dispersed relationship between Brent Crude Oil prices (X-axis, USD/barrel) and the S&P 500 index (Y-axis). While the upward linear trend is discernible — higher oil prices are loosely associated with higher S&P 500 values — the scatter is extraordinarily wide across the full range. This wide dispersion immediately signals that crude oil price alone is a weak standalone predictor of equity market levels. The fitted linear regression (y = 11.521x + 650.956) captures the directional tendency but leaves the majority of data points far from the regression line, particularly at mid-range X values (roughly 40–80 USD/barrel) where Y values span nearly the entire observable range from ~250 to over 3,200.
2. Correlation Strength, Explained Variance, and Causality The Pearson r of 0.5378 indicates a moderate positive correlation, but the more telling statistic is r² = 0.289, meaning crude oil prices explain only ~29% of the variance in S&P 500 levels. Roughly 71% of S&P 500 variability is driven by factors entirely unrelated to oil prices within this model. The 95% confidence interval [0.5221, 0.5530] is narrow — a direct consequence of the large paired sample (n = 8,140) — confirming that the correlation estimate is statistically precise and stable, not a sampling artifact. The p-value of effectively zero confirms the correlation is highly statistically significant. However, statistical significance here should not be confused with practical predictive power; the wide CI exclusion of zero merely confirms the relationship exists, not that it is strong. Most critically, Granger causality tests find no significant predictive direction in either direction (X→Y: F=0.904, p=0.342; Y→X: F=0.863, p=0.353), meaning neither variable temporally predicts the other at a 1-period lag. This effectively rules out a straightforward leading-indicator relationship between daily oil prices and S&P 500 movements.
3. Notable Patterns, Clusters, and Non-Linear Features Several structural features stand out in the sample points. There is a pronounced lower-left cluster at low oil prices (X < 25) where S&P 500 values are themselves broadly scattered but tend to be lower — reflecting the late 1980s and early 1990s era when both series were at historically modest levels. A mid-range cluster (X: 50–80, Y: 800–3,000+) shows the greatest vertical dispersion, consistent with multiple distinct historical periods sharing similar oil price bands but wildly different equity valuations (e.g., pre-2008 boom versus post-2009 recovery versus 2018 levels). Critically, the Spearman ρ exceeding Pearson r flags a meaningful non-linear component — a logarithmic or polynomial fit would likely outperform the linear model, suggesting diminishing marginal association at higher oil price levels. Some high-X outliers (X 100, representing the 2011–2014 oil price spike era) show moderate-to-high Y values, consistent with QE-driven equity gains decoupling from commodity fundamentals during that period.
4. Confounding Factors and Interpretive Caveats This correlation is almost certainly a spurious co-trending artifact rather than a genuine structural relationship. Both series share a common driver: long-run nominal growth and inflation over the 1987–2019 period cause most financial assets to trend upward together, creating correlation even when the underlying causal mechanisms are entirely independent. The USD exchange rate is a major confounder — a weaker dollar simultaneously lifts oil prices (denominated in USD) and often supports equity valuations. Macroeconomic regime shifts (recessions, QE cycles, OPEC supply shocks, geopolitical events) affect both variables but through completely different channels and with different lags. Additionally, matching daily S&P 500 and Brent prices introduces calendar misalignment (trading holidays differ between equity and commodity markets), and the dataset spans multiple structural breaks — the 2008 financial crisis, 2014–2016 oil collapse, and 2018 volatility — each representing distinct economic regimes where the oil-equity relationship actually reversed sign temporarily.
5. Actionable Insights and Further Investigation Given these findings, several investigative directions are warranted. First, replacing levels with log-returns or first differences would remove the shared trend and test whether short-term daily movements in oil genuinely co-move with equities — a far more rigorous test of the relationship. Second, regime-segmented analysis (splitting by pre/post-2008, or by oil market structural breaks) would reveal whether the correlation is stable or highly time-varying; the Granger non-causality result at lag-1 suggests exploring longer lags (5–20 trading days) may be more economically meaningful. Third, fitting a logarithmic or polynomial regression is directly recommended given the Spearman-Pearson divergence. Fourth, incorporating sector-level S&P data (energy vs. non-energy components) would test whether the aggregate correlation masks a strong positive relationship in energy stocks and a negative or neutral relationship elsewhere. Finally, controlling for the USD index (DXY) and 10-year Treasury yields in a multivariate framework would help isolate any genuine oil-equity relationship from the dominant macro confounders.
X dataset: Brent Crude Oil Prices: Daily (DCOILBRENTEU) – FRED St. Louis Fed
Y dataset: S&P 500 Daily Time Series since 1927 (GitHub fja05680) (Date)
Part of experiment: Daily - Brent Crude Oil Prices: Daily (DCOILBRENTEU) – FRED St. Louis Fed vs S&P 500 Daily Time Series since 1927 (GitHub fja05680) (Date)