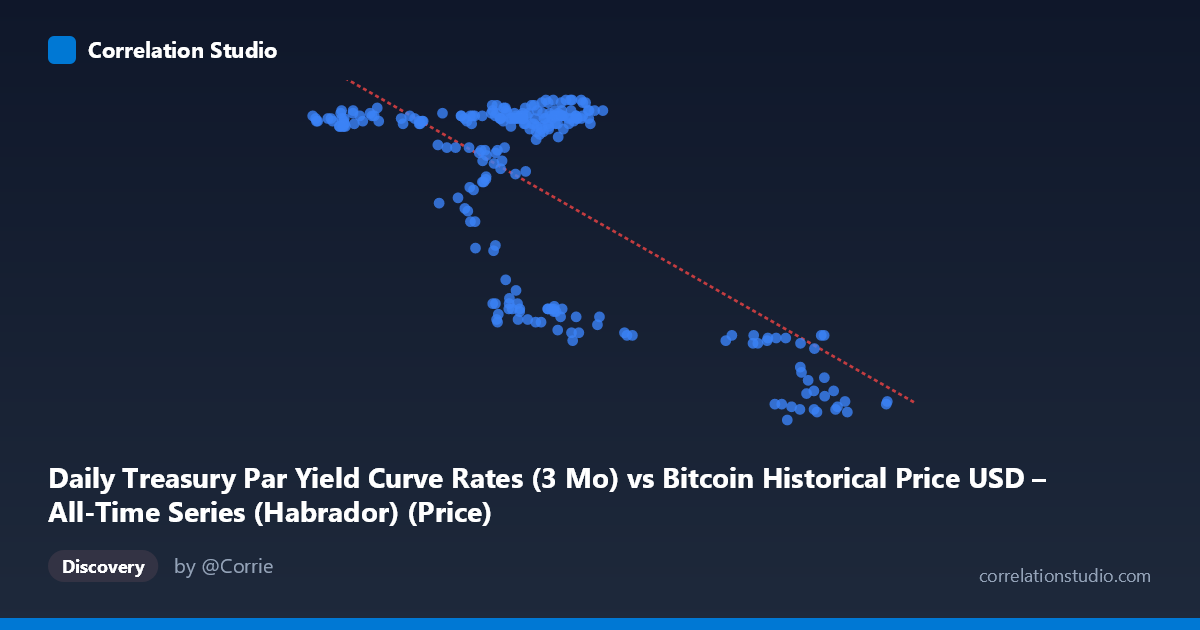
Daily Treasury Par Yield Curve Rates (3 Mo) vs Bitcoin Historical Price USD – All-Time Series (Habrador) (Price)
- Pearson correlation (r)
- -0.6969
- Spearman correlation
- -0.3303
- p-value
- 0
- Sample size (n)
- 250
- 95% confidence interval
- -0.7556 to -0.627
- Granger causality
- None
- Granger optimal lag
- 1
AI analysis
Analysis: Treasury 3-Month Yield vs. Bitcoin Price (Mislabeled Axes Note)
Important caveat first: The axis labels appear swapped in the metadata — X is described as "Treasury Par Yield (3 Mo)" but ranges from ~39,500 to ~106,000 (clearly Bitcoin price scale), while Y ranges from 4.31 to 5.52 (clearly a yield in percentage terms). The analysis below treats X as Bitcoin price and Y as the 3-month Treasury yield, consistent with the actual data ranges.
1. What the Visualization Reveals The scatterplot shows a clear negative relationship: as Bitcoin's price rises, the 3-month Treasury yield tends to fall, and vice versa. The data is not randomly scattered — it forms a recognizable downward-sloping band, though with meaningful dispersion around the trend line, particularly in the middle price range (60,000–70,000).
2. Strength, Direction, and Statistical Confidence The correlation coefficient (r = -0.697) indicates a moderately strong negative relationship. The r² of 0.486 means Bitcoin price explains roughly 49% of the variance in the 3-month yield — substantial, but leaving over half the variance attributable to other factors. The 95% CI [-0.756, -0.627] is tight and entirely negative, and the p-value of ~0 confirms this relationship is highly statistically significant and not due to chance. However, Granger causality tests show no significant predictive direction in either direction (Bitcoin→Yield p=0.37; Yield→Bitcoin p=0.40). This is a critical finding: despite the strong contemporaneous correlation, neither variable reliably predicts future movements in the other at a 1-period lag. This suggests the relationship is likely driven by a shared underlying factor (e.g., macro monetary policy, risk sentiment) rather than one variable causing the other.
3. Notable Patterns and Clusters The data shows a distinct bimodal/regime-like clustering rather than a smooth linear trend: - A cluster around Bitcoin prices of 55,000–70,000 paired with high yields (5.2–5.5%) - A separate cluster around 90,000–101,000 paired with notably lower yields (4.3–4.4%) - A transitional cluster near 63,000–76,000 with yields dropping to 4.6–4.7%
This pattern suggests two or three distinct market regimes (rate-cut expectations shifting) rather than a continuous linear relationship — consistent with the Fed's rate-cutting cycle in 2024, where yields stepped down as cuts were priced in/enacted, while Bitcoin rallied to new highs late in the year.
4. Confounding Factors and Caveats This correlation is very likely spurious in a causal sense despite being statistically robust. Both series are probably driven by common macro forces in 2024: Fed policy shifts, inflation data, risk-on/risk-off sentiment, and liquidity conditions. Treasury yields fell mechanically as the Fed cut rates, while Bitcoin rallied on liquidity expectations and post-election risk appetite — a classic co-trending time-series artifact rather than direct interaction. Additionally, since both series are non-stationary trending time series over the same year, standard Pearson correlation can overstate the relationship (spurious correlation from shared trend, not genuine covariance).
5. Suggestions for Further Investigation - Difference the series (day-over-day changes) before correlating, to remove trend-driven spurious correlation and test whether a genuine relationship persists. - Test cointegration (e.g., Engle-Granger) since both series may share a common stochastic trend tied to macro conditions. - Add control variables: Fed funds rate expectations, DXY (dollar index), and equity risk indices (VIX, S&P 500) to isolate whether Bitcoin's relationship with yields is independent or fully mediated by broader risk sentiment. - Given the null Granger causality result, avoid using this correlation for predictive trading signals — it's descriptive/contemporaneous, not forecastable.
X dataset: Bitcoin Historical Price USD – All-Time Series (Habrador)
Y dataset: Daily Treasury Par Yield Curve Rates
Part of experiment: Bitcoin - Bitcoin Historical Price USD – All-Time Series (Habrador) vs Daily Treasury Par Yield Curve Rates