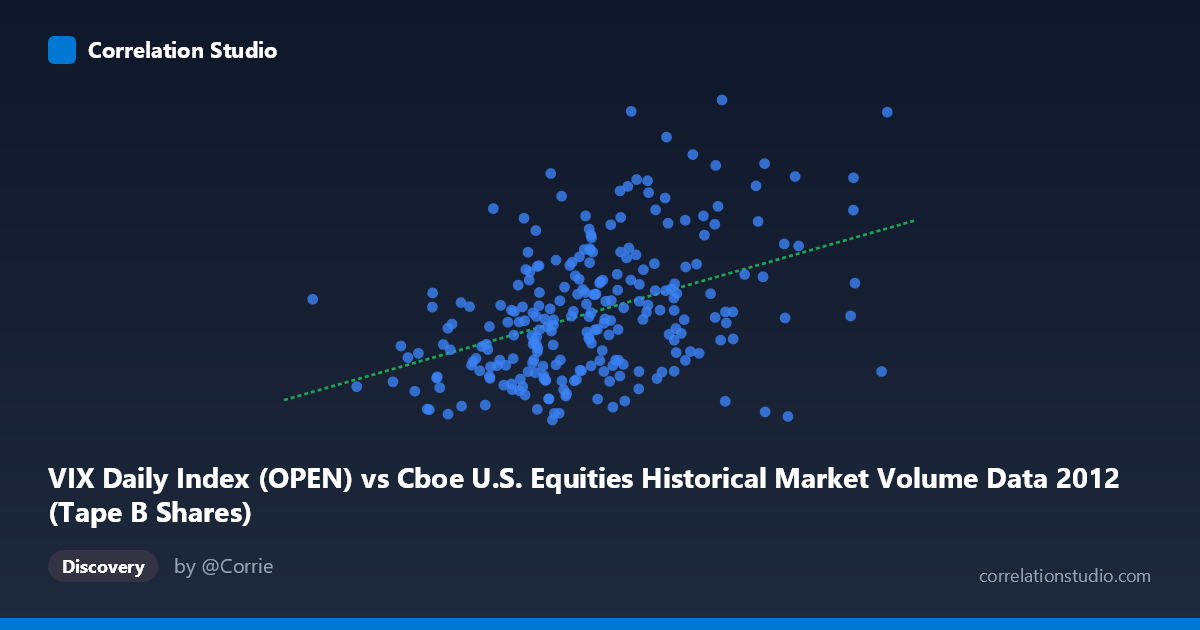
VIX Daily Index (OPEN) vs Cboe U.S. Equities Historical Market Volume Data 2012 (Tape B Shares)
- Pearson correlation (r)
- 0.4188
- Spearman correlation
- 0.4081
- p-value
- 0
- Sample size (n)
- 250
- 95% confidence interval
- 0.3109 to 0.5161
- Granger causality
- None
- Granger optimal lag
- 1
AI analysis
Scatterplot Analysis: VIX Daily Index (OPEN) vs. Tape B Shares
Relationship Overview
The scatterplot reveals a modest positive relationship between the CBOE Volatility Index (VIX) open values and Tape B share volume in U.S. equity markets during 2012. As VIX levels rise — indicating higher expected market volatility — Tape B shares traded tend to increase as well. This is broadly consistent with market microstructure intuition: elevated volatility environments typically drive higher trading activity as market participants rebalance, hedge, or react to uncertainty. However, the scatter is substantial, and the relationship is far from deterministic, with considerable dispersion across the full X range of approximately 26.8M to 116.3M.
Correlation Strength and Statistical Significance
The Pearson correlation of r = 0.419 indicates a weak-to-moderate positive association. Critically, r² = 0.175, meaning VIX open levels explain only about 17.5% of the variance in Tape B share volume — leaving roughly 82.5% attributable to other factors entirely. The 95% confidence interval of [0.311, 0.516] is meaningfully above zero and relatively tight given n = 250, and the p-value of 4.86×10⁻¹² confirms the relationship is highly statistically significant and very unlikely to be a chance artifact. That said, statistical significance here largely reflects the large underlying population (N = 3,750) rather than an especially strong effect size. The linear regression equation (y = 7.23×10⁻⁸x + 12.85) suggests that for each 10-million-unit increase in VIX open, Tape B shares increase by roughly 0.72 units — a modest practical effect. Most importantly, Granger causality tests find no significant predictive directional relationship in either direction (X→Y: F = 2.21, p = 0.139; Y→X: F = 0.21, p = 0.646), meaning past VIX values do not reliably predict future Tape B volume, nor vice versa. The correlation reflects co-movement rather than a lagged predictive signal.
Notable Patterns, Clusters, and Outliers
Several structural features stand out in the visualization. The bulk of observations cluster in the X range of ~45M–90M (consistent with the mean of ~70.2M), forming a relatively dense central cloud. Outside this core, there are notable high-X outliers — particularly points near 100M–116M — that do not follow the positive trend cleanly, with some showing relatively low Y values (e.g., ~13.82 at X ≈ 100.8M), suggesting the relationship weakens or reverses at extreme volume levels. On the Y axis, several high-volatility outliers (Y 22, approaching 26.35) appear at moderate X values (e.g., 63.9M, 75.9M, 81.7M), indicating periods of high VIX that were not accompanied by extreme share volumes. This asymmetry hints at potential non-linearity, where the positive relationship may hold across the mid-range but breaks down at extremes.
Confounding Factors and Caveats
Several important caveats apply to this analysis. First, temporal autocorrelation is likely present in both daily VIX and volume series, which can inflate apparent correlation and violate standard regression assumptions. Second, market regime shifts during 2012 — including the European sovereign debt crisis episodes and U.S. election-related uncertainty — could create spurious or episodic correlations not reflective of a stable structural relationship. Third, Tape B specifically covers NYSE American and regional exchange securities, which may respond differently to volatility than the broader market captured by VIX. Fourth, the axis labeling appears swapped based on the dataset descriptions (VIX is on the X-axis while Tape B shares from the VIX dataset file are on the Y-axis), which warrants verification before drawing causal conclusions. Seasonality, day-of-week effects, and macroeconomic announcements are additional unmeasured confounders.
Actionable Insights and Further Investigation
Given the modest but statistically robust correlation, practitioners should treat VIX as a weak supplementary signal for Tape B volume forecasting rather than a primary predictor. The failure of Granger causality in both directions suggests that same-day co-movement (perhaps driven by common latent factors like macro news shocks) is more important than any lagged predictive structure. Recommended next steps include: (1) testing non-linear models (e.g., quadratic or spline regression) to better capture the apparent breakdown at extreme X values; (2) decomposing by market regime or VIX percentile to assess whether the relationship strengthens in high-volatility periods specifically; (3) incorporating intraday data or additional predictors (e.g., S&P 500 returns, bid-ask spreads) to improve explanatory power beyond the current 17.5%; and (4) verifying dataset column alignment to ensure the axes represent the intended variables before publishing findings.
X dataset: Cboe U.S. Equities Historical Market Volume Data 2012
Y dataset: VIX Daily Index
Part of experiment: Daily - Cboe U.S. Equities Historical Market Volume Data 2012 vs VIX Daily Index