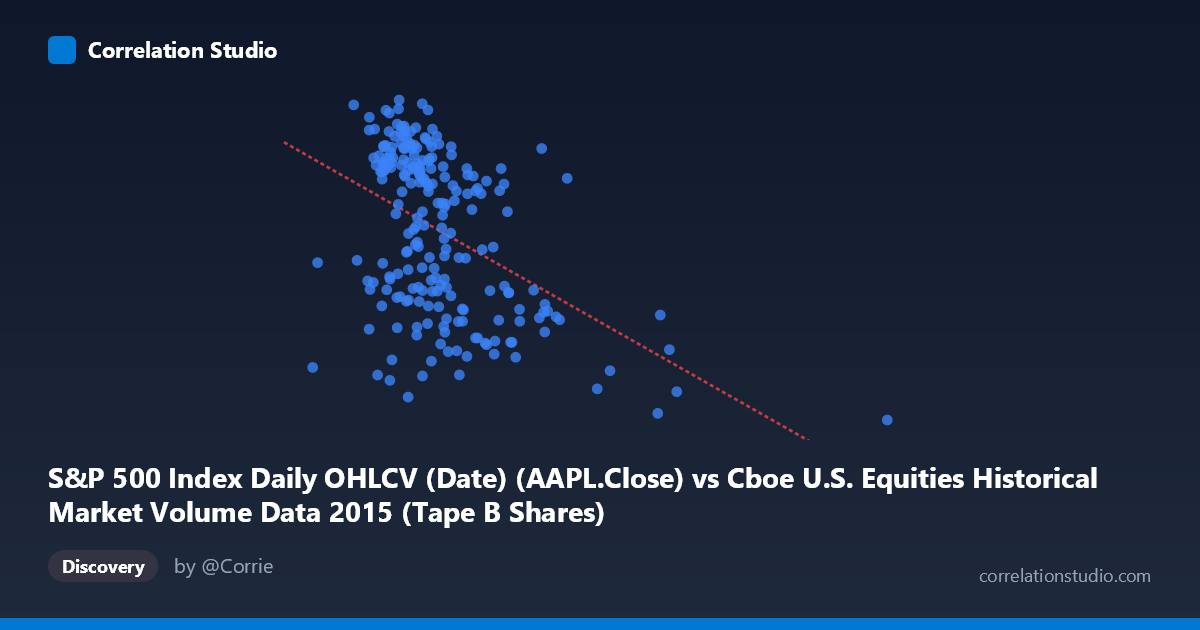
S&P 500 Index Daily OHLCV (Date) (AAPL.Close) vs Cboe U.S. Equities Historical Market Volume Data 2015 (Tape B Shares)
- Pearson correlation (r)
- -0.454
- Spearman correlation
- -0.4427
- p-value
- 0
- Sample size (n)
- 222
- 95% confidence interval
- -0.5527 to -0.3428
- Granger causality
- None
- Granger optimal lag
- 1
AI analysis
Scatterplot Analysis: AAPL Close Price vs. Cboe Tape B Share Volume (2015)
Relationship Overview The scatterplot reveals a negative relationship between Apple's closing stock price (X-axis) and Cboe Tape B share volume (Y-axis) across 222 trading days in 2015. As AAPL's closing price increases, Tape B share volume tends to decrease. The linear regression equation (y = -1.14×10⁻⁷x + 132.576) reflects this downward slope, suggesting that higher AAPL valuations coincide with lower Tape B market activity. This is an intriguing cross-dataset pairing — one measuring a single equity's price, the other measuring broader exchange-level volume — making the relationship economically meaningful to interrogate rather than immediately obvious.
Correlation Strength and Statistical Significance The Pearson correlation of r = -0.454 indicates a moderate negative association, but the explanatory power is modest: R² = 0.206, meaning AAPL's closing price accounts for only about 20.6% of the variance in Tape B share volume, leaving roughly 79% explained by other factors. The 95% confidence interval of [-0.553, -0.343] is entirely negative, confirming directional consistency, and the p-value of 1.09×10⁻¹² makes this correlation highly statistically significant — effectively ruling out chance. However, statistical significance should not be conflated with practical magnitude here; the effect is real but far from dominant. Critically, Granger causality tests find no significant predictive directionality in either direction (X→Y: F=0.716, p=0.399; Y→X: F=0.398, p=0.529), meaning AAPL's price does not temporally predict future Tape B volume, nor vice versa. This strongly cautions against any causal interpretation.
Notable Patterns, Clusters, and Outliers The data cluster most densely in the $75M–$130M AAPL price range (roughly 70–130M on the x-axis), where Tape B volume spans a wide band from ~110 to ~133, suggesting high variability at typical price levels. Two notable outliers stand out: the point at approximately (311,969,106, 103.12) sits far to the right with very low Tape B volume — a likely data anomaly or extreme market event — and (205,030,140, 103.74) similarly deviates from the main cluster. These high-X, low-Y outliers disproportionately anchor the negative slope and may inflate the apparent correlation. Removing them would likely weaken the r value meaningfully.
Confounding Factors and Interpretive Caveats Several confounds complicate this relationship. First, both variables are time-indexed to 2015, meaning broader market regime changes — volatility events, the August 2015 correction, Federal Reserve policy shifts — could simultaneously depress AAPL prices and alter exchange volumes, creating spurious correlation driven by a common temporal factor. Second, the dataset mismatch is notable: AAPL close price is a single-stock metric, while Tape B volume aggregates activity across many securities on regional exchanges. Any correlation may reflect macro market conditions rather than a direct link. Third, the outliers identified above likely correspond to specific high-volume or anomalous trading days that distort the regression line, and their provenance should be verified.
Actionable Insights and Further Investigation Given the lack of Granger causality, practitioners should avoid using AAPL price as a leading indicator for Tape B volume forecasting. Instead, further investigation should: (1) remove or flag the two far-right outliers and recompute r to assess their influence on the overall correlation; (2) introduce time as an explicit variable or apply detrending to isolate whether the correlation persists after removing shared temporal trends; (3) test other single-stock prices or indices (e.g., SPY, VIX) against Tape B volume to determine whether this pattern is AAPL-specific or a market-wide phenomenon; and (4) explore non-linear regression models, as the scatter suggests potential heteroscedasticity — variance in Tape B appears to compress at extreme AAPL price values — which a simple linear model underrepresents.
X dataset: Cboe U.S. Equities Historical Market Volume Data 2015
Y dataset: S&P 500 Index Daily OHLCV (Date)
Part of experiment: Daily - Cboe U.S. Equities Historical Market Volume Data 2015 vs S&P 500 Index Daily OHLCV (Date)