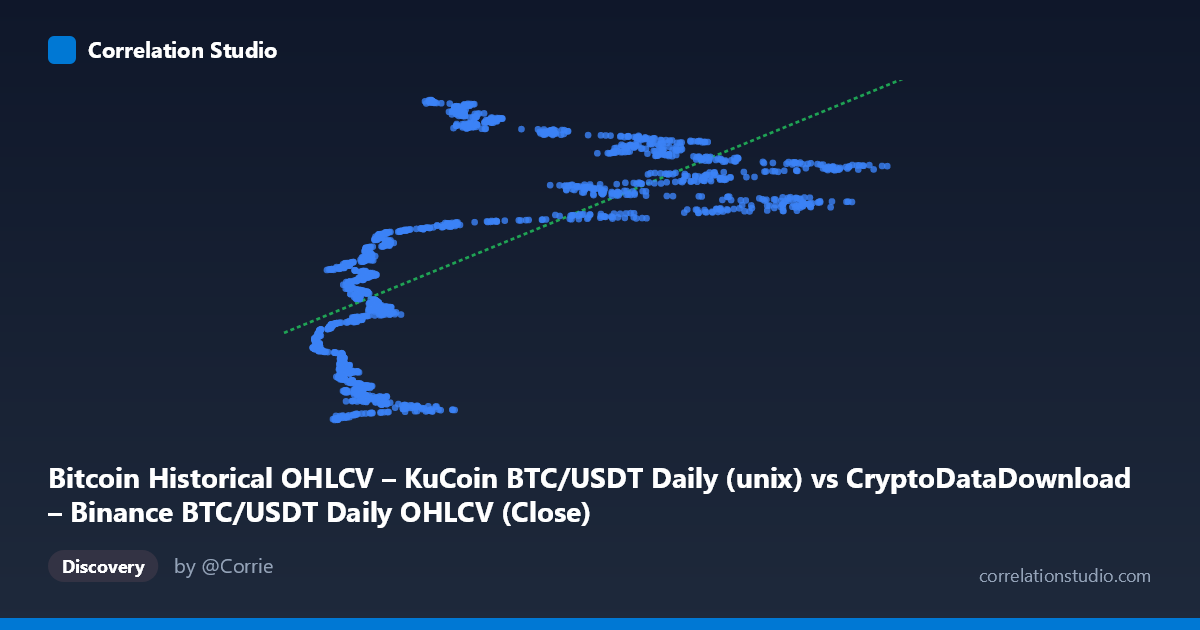
Bitcoin Historical OHLCV – KuCoin BTC/USDT Daily (unix) vs CryptoDataDownload – Binance BTC/USDT Daily OHLCV (Close)
- Pearson correlation (r)
- 0.6741
- Spearman correlation
- 0.7543
- p-value
- 0
- Sample size (n)
- 1861
- 95% confidence interval
- 0.6486 to 0.6982
- Granger causality
- None
- Granger optimal lag
- 10
- Time coverage
- 2017-10-19 to 2022-11-29
AI analysis
Analysis: BTC/USDT Trading Volume vs. Timestamp
1. What the Visualization Reveals
This scatterplot is actually comparing Bitcoin trading volume (X-axis) against the Unix timestamp of the observation (Y-axis, rendered as a date value in seconds-since-epoch format). Effectively, this plot shows how BTC/USDT volume has trended over calendar time from late 2017 through late 2022. The relationship visible is not a relationship between two independent market variables, but rather a time-series trend: does trading volume tend to be higher or lower at different points in Bitcoin's history?
2. Strength, Direction, and Statistical Meaning
The correlation coefficient (r = 0.674) indicates a moderate-to-strong positive relationship: as time progresses, volume tends to increase. However, r² = 0.454 tells the more important story — only 45% of the variance in the timestamp variable is explained by volume (or vice versa), leaving over half of the variance driven by other factors or noise. The 95% CI [0.649, 0.698] is fairly tight given the large sample (n=1,861), and the p-value of ~0 confirms this relationship is not due to chance. However, statistical significance with large N is expected even for modest effect sizes — significance here should not be conflated with strength of practical predictive power. The Granger causality results are notable: neither direction shows significant predictive causality (X→Y: p=0.837; Y→X: p=0.074, marginally suggestive but not significant at 0.05). This confirms that this is a contemporaneous/structural association rather than one where past volume values help forecast future timestamps (which is a somewhat tautological test given X and Y here) — practically, this suggests volume levels don't show strong lagged predictive structure relative to calendar time beyond the trend itself.
3. Notable Patterns and Non-Linear Features
Looking at the sample points, several clusters emerge: - Low-volume/early cluster: Values with X < 10,000 concentrate heavily in 2017-2018 (timestamps ~1.51–1.55B) and again oddly in 2020-2021 periods (~1.56–1.60B), suggesting volume didn't monotonically increase — there were low-volume periods recurring later in the series. - High-volume cluster: X 40,000 clusters tightly around 2021-2022 (timestamps ~1.61–1.65B), consistent with the well-known 2021 bull-run volume surge. - The relationship appears non-linear/heteroskedastic: variance in volume increases substantially in later periods, suggesting volatility clustering rather than a clean linear trend. A simple linear fit (R²=0.454) likely understates the fit during high-volatility bull/bear cycles and overstates it during quiet periods. - No obvious single outliers dominate, but the "double-back" pattern (high volume in 2018, dip in 2019-2020, then spike in 2021) suggests a cyclical rather than linear structure — the linear regression slope (1849.31x + 1.55B) is a rough approximation of a more complex, cyclical pattern.
4. Confounding Factors and Caveats
Several caveats apply: - Structural market regime changes: BTC volume is heavily influenced by external events (COVID crash in 2020, 2021 bull run, Terra/Luna and FTX collapses in 2022) that create step-changes rather than smooth trends — a linear model is a poor structural descriptor. - Exchange/data source mismatch: X is sourced from Binance OHLCV while Y is labeled as sourced from KuCoin in the metadata, though it's being used as a timestamp proxy — this cross-exchange labeling is confusing and should be clarified, as volume figures can differ significantly by exchange due to differing liquidity and reporting standards. - Autocorrelation: Both time series (volume and time itself) are highly autocorrelated, inflating the apparent r without necessarily indicating a meaningful causal/predictive relationship — this is a classic pitfall of correlating any variable against a monotonic time index. - Survivorship/selection: Only 1,861 days are included; gaps or missing days could bias volume aggregates.
5. Actionable Insights and Further Investigation
- Reframe the analysis: Rather than correlating volume against raw timestamp, decompose into seasonal/cyclical components (e.g., regress volume against known market regime indicators, halving cycles, or volatility indices) for more actionable insight. - Test with detrended/differenced series: Apply first-differencing or log-transform volume before Granger testing, since raw non-stationary series (both volume and time) can produce spurious correlation/causality results. - Segment by market regime: Split data into bull/bear/accumulation phases and re-run correlation — the aggregate r is likely masking very different relationships in each regime. - Cross-validate exchanges: Compare Binance vs. KuCoin volume/price data directly (rather than against time) to check for exchange-specific volume anomalies or wash trading effects, which are common concerns in crypto volume data.
X dataset: CryptoDataDownload – Binance BTC/USDT Daily OHLCV
Y dataset: Bitcoin Historical OHLCV – KuCoin BTC/USDT Daily
Part of experiment: Bitcoin - CryptoDataDownload – Binance BTC/USDT Daily OHLCV vs Bitcoin Historical OHLCV – KuCoin BTC/USDT Daily