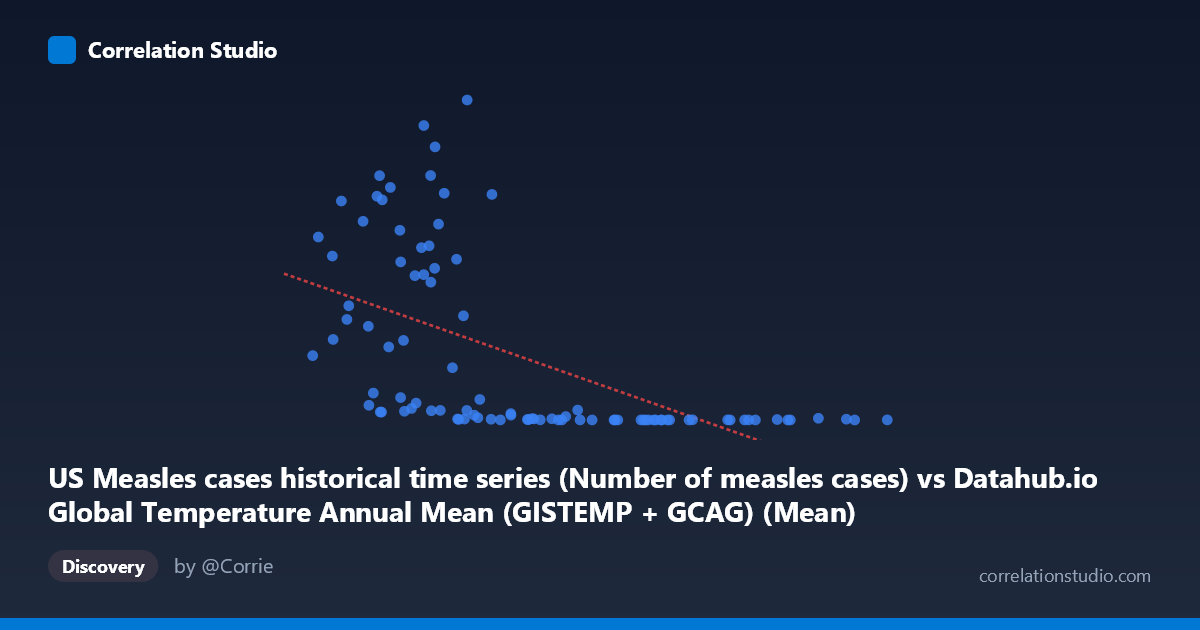
US Measles cases historical time series (Number of measles cases) vs Datahub.io Global Temperature Annual Mean (GISTEMP + GCAG) (Mean)
- Pearson correlation (r)
- -0.5554
- Spearman correlation
- -0.7986
- p-value
- 0
- Sample size (n)
- 93
- 95% confidence interval
- -0.682 to -0.3966
- Granger causality
- Y → X
- Granger optimal lag
- 10
- Time coverage
- 1919-01-01 to 2026-01-01
- Recomputed on refreshed data
- 2026-11-01 (r was -0.5556)
AI analysis
Analysis: US Measles Cases vs. Global Temperature Anomalies (1919–2026)
1. What the Visualization Reveals
The scatterplot reveals a striking inverse relationship between annual global temperature anomalies (X-axis) and US measles case counts (Y-axis). Data points cluster into two visually distinct regions: a high-Y, low-X zone where temperature anomalies are near or below zero and measles cases reach into the hundreds of thousands, and a low-Y, high-X zone where warmer anomalies coincide with dramatically reduced case counts (often below 1,000). This bifurcated pattern immediately suggests that the relationship is not merely statistical noise — it reflects a real historical transition, with high measles burdens concentrated in the pre-vaccine era (roughly pre-1963) and low burdens in the modern, warmer period. The linear regression line (y = −368,826x + 268,725) captures the general downward slope but visibly struggles to describe the data's spread, particularly the extreme vertical dispersion at low X values.
2. Correlation Strength, Direction, and Causality
The Pearson correlation of r = −0.556 indicates a moderate-to-strong negative association, but the explained variance tells a more sobering story: R² = 0.309, meaning temperature anomalies account for only about 31% of the variance in measles cases, leaving nearly 70% unexplained by this model alone. The 95% confidence interval for r [−0.682, −0.397] is entirely negative and does not cross zero, and the p-value of 7.5 × 10⁻⁹ confirms the correlation is highly statistically significant — this is not a chance finding given N = 93. However, statistical significance must not be conflated with practical or causal significance. Critically, the Granger causality analysis points in the opposite direction from what a causal story would require: Y (measles cases) Granger-causes X (temperature anomalies) at a 10-period lag (F = 2.09, p = 0.039), while X does not Granger-cause Y (F = 1.21, p = 0.300). This means past measles case counts have marginal temporal predictive power over temperature readings — a finding that is almost certainly spurious — while temperature does not temporally predict measles cases. This firmly rules out any direct causal pathway from temperature to measles transmission.
3. Notable Patterns, Clusters, Outliers, and Non-Linearity
Several features stand out beyond the linear summary. First, the data exhibit a pronounced non-linear, approximately logarithmic or exponential decay structure: Y values drop precipitously as X moves from negative to modest positive values, then flatten near zero for X 0.5°C. This is consistent with the note that Spearman ρ exceeds Pearson r, confirming the linear model is a poor functional form for this data. Second, there are notable high-leverage outliers in the upper-left quadrant — points such as (0.11, 894,134), (0.02, 763,094), and (−0.01, 822,811) represent years of enormous measles burden that exert strong influence on the regression slope. Third, the right portion of the chart (X 0.5) shows a dense, flat cluster of very low case counts (< 2,000), reflecting the post-vaccination era uniformity. Fourth, a few anomalous points — (1.03, 1,952), (1.12, 2,288), and (0.93, 1,274) — show that even in very warm years, small measles outbreaks still occur, likely representing modern resurgence events tied to vaccine hesitancy rather than climate.
4. Confounding Factors and Caveats
The dominant confounding variable here is time itself. Both variables are trending across the 20th and 21st centuries in correlated directions: global temperatures have risen steadily due to greenhouse gas emissions, while measles cases collapsed following the introduction of the measles vaccine in 1963 and subsequent immunization programs. These two trends are temporally correlated but causally independent — they share a common time axis, not a common mechanism. This is a textbook case of spurious correlation driven by shared secular trends. Additional confounders include population growth (affecting raw case counts), changes in surveillance and reporting fidelity, urbanization patterns affecting transmission dynamics, international travel exposure, and periodic outbreaks driven by vaccination coverage gaps. The wide vertical spread of Y at similar X values (e.g., cases ranging from ~1,700 to ~894,000 all near X = 0.08–0.11°C) powerfully illustrates that temperature alone has negligible explanatory power within any given temperature band.
5. Actionable Insights and Further Investigation
The most immediate actionable insight is do not interpret this correlation as evidence that warming reduces measles — the relationship is almost certainly entirely spurious, mediated by time. For further investigation, the most productive step would be to partial out the time trend from both variables (e.g., detrending or using first differences) and re-examine the residual correlation; it would likely shrink substantially toward zero. Researchers should also consider modeling measles cases against vaccination coverage rates, public health investment, or herd immunity thresholds, which would yield far more mechanistically coherent predictors. A logarithmic transformation of Y (measles cases) should be applied before any regression modeling, given the evident right skew and the non-linear decay structure visible in the chart — this would also better satisfy linear regression assumptions. Finally, the anomalous high-case modern outliers (post-2000 resurgence clusters) deserve separate investigation as a structural break in the time series, potentially modeled as a distinct regime driven by anti-vaccine movements rather than climate or historical epidemiology.
X dataset: Datahub.io Global Temperature Annual Mean (GISTEMP + GCAG)
Y dataset: US Measles cases historical time series
Part of experiment: Yearly - Datahub.io Global Temperature Annual Mean (GISTEMP + GCAG) vs US Measles cases historical time series