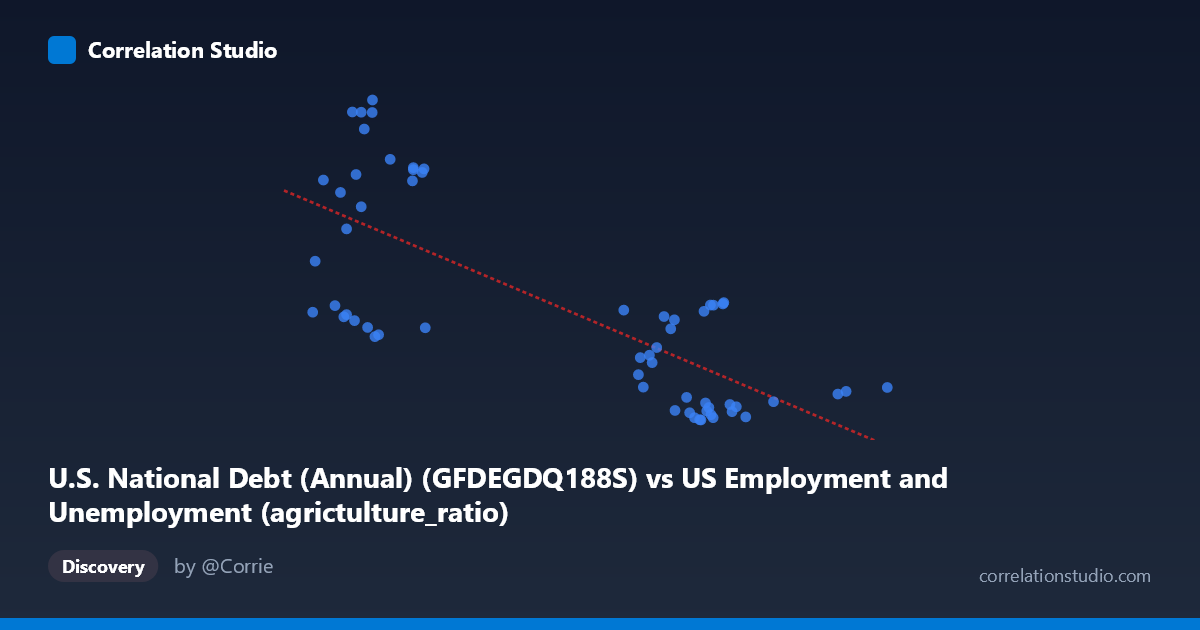
U.S. National Debt (Annual) (GFDEGDQ188S) vs US Employment and Unemployment (agrictulture_ratio)
- Pearson correlation (r)
- -0.7501
- Spearman correlation
- -0.6554
- p-value
- 0
- Sample size (n)
- 60
- 95% confidence interval
- -0.8434 to -0.6129
- Granger causality
- None
- Granger optimal lag
- 10
AI analysis
Scatterplot Analysis: U.S. National Debt vs. Agricultural Employment Ratio
Overview of the Relationship
The scatterplot reveals a moderately strong negative relationship between U.S. National Debt (as a percent of GDP) and the U.S. agricultural employment ratio. As national debt rises, the proportion of employment in agriculture tends to decline. The linear regression equation (y = -0.037578x + 172.874) confirms this inverse trajectory, suggesting that for each unit increase in the debt-to-GDP ratio, the agricultural employment share falls by approximately 0.038 percentage points. Visually, the data points trend downward from left to right, though with notable scatter, indicating that while the relationship is real, it is far from deterministic. The data spans roughly six decades (1966–2025), meaning both variables have undergone substantial structural transformation over the period.
Correlation Strength, Statistical Significance, and Causal Direction
The Pearson correlation of r = -0.7501 indicates a moderately strong negative association, and the R² of 0.5627 means that approximately 56.3% of the variance in the agricultural employment ratio is statistically explained by national debt levels — a meaningful but incomplete picture, leaving nearly 44% of variance attributable to other factors. The 95% confidence interval for r spans [-0.8434, -0.6129], which is reasonably tight and does not cross zero, reinforcing that the negative direction of the relationship is robust. The p-value of 5.265×10⁻¹² is highly significant (far below α = 0.05), confirming this is extremely unlikely to be a chance finding in a sample of n = 60. However, Granger causality analysis tells a very different story: neither direction of temporal predictability achieves significance (X→Y: F = 0.49, p = 0.88; Y→X: F = 1.01, p = 0.46), even at an optimal lag of 10 periods. This means that past values of national debt do not meaningfully predict future agricultural employment ratios, and vice versa — a critical caveat that cautions against any causal interpretation.
Notable Patterns, Clusters, and Outliers
The scatterplot exhibits two fairly distinct clusters. One cluster occupies the lower-left region (debt values roughly 2095–2500, agricultural ratios ~55–124), showing high agricultural employment alongside relatively lower debt — consistent with earlier decades when both the debt ratio was more contained and agriculture was a larger employer. A second, denser cluster sits in the upper-right region (debt values ~3100–3980, agricultural ratios ~30–65), reflecting more recent years of elevated debt and dramatically reduced agricultural employment shares. Several potential outliers are visible: points near Y ≈ 120–124 (e.g., coordinates like (2291, 124.04) and (2254, 120.48)) sit at the upper bound of agricultural employment and represent anomalously high ratios given their debt levels. Conversely, the point at (3979, 40.34) sits at the far right of the X-axis, representing the highest debt observation. The spread within each cluster also hints at non-linearity — the relationship may be steeper at lower debt levels and flatten as debt grows, suggesting a possible curvilinear or threshold structure worth modeling.
Confounding Factors and Interpretive Caveats
The correlation almost certainly reflects parallel long-run trends rather than a direct mechanistic link. Both variables are independently driven by the passage of time: agricultural employment has declined secularly due to mechanization, globalization, and rural-to-urban migration, while national debt has grown due to fiscal policy, war spending, social program expansion, and financial crises. This is a textbook case of spurious correlation via shared time trends — two variables moving in opposite directions across decades without one causing the other. The absence of Granger causality strengthens this interpretation. Additional confounders include GDP growth (which simultaneously depresses the debt ratio and draws workers into higher-productivity sectors), demographic shifts, farm subsidy policy, and technological change in agriculture. Furthermore, the dataset spans N = 86 total observations but uses only n = 60 paired samples, and annual aggregation may mask within-year dynamics.
Actionable Insights and Further Investigation
Given the likely spurious nature of this correlation, the most productive next step would be to detrend both time series (e.g., via first-differencing or HP filtering) and re-examine whether any residual association persists after removing shared secular trends. Researchers should also explore multivariate modeling that controls for GDP growth, technological adoption indices, and policy variables to isolate any genuine fiscal-agricultural linkage. Testing for structural breaks around events like the 2008 financial crisis or major farm legislation could reveal whether the relationship changed character at specific moments. Finally, examining regional disaggregation — comparing states with high agricultural dependence against the national debt trajectory — could help separate sector-specific dynamics from macro-fiscal ones. In practical terms, policymakers should not interpret this correlation as evidence that debt reduction would reverse agricultural employment declines; the drivers of that structural shift operate largely independently of fiscal policy.
X dataset: US Employment and Unemployment
Y dataset: U.S. National Debt (Annual)
Part of experiment: Yearly - US Employment and Unemployment vs U.S. National Debt (Annual)