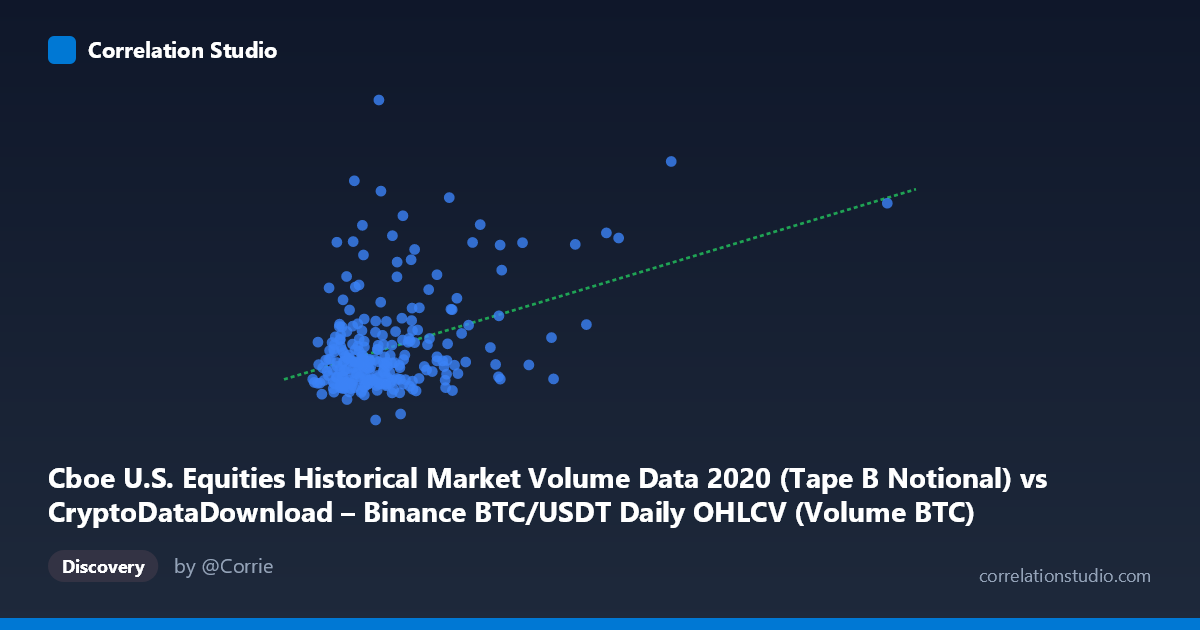
Cboe U.S. Equities Historical Market Volume Data 2020 (Tape B Notional) vs CryptoDataDownload – Binance BTC/USDT Daily OHLCV (Volume BTC)
- Pearson correlation (r)
- 0.4021
- Spearman correlation
- 0.2221
- p-value
- 0
- Sample size (n)
- 253
- 95% confidence interval
- 0.2933 to 0.5006
- Granger causality
- None
- Granger optimal lag
- 10
AI analysis
Analysis: Cboe U.S. Equities Volume vs. Binance BTC/USDT Volume (2020)
1. Relationship Overview
The scatterplot depicts a weak-to-moderate positive relationship between Cboe U.S. equities notional volume (X) and Binance BTC/USDT trading volume (Y) across 253 trading days in 2020. The data cloud is diffuse, with most points clustered in the lower-left region (X: 30,000–120,000; Y: 2–10 billion), while a a long right-tail of high-Y outliers and a single extreme X outlier (402,201.67) create visual noise that masks any tight linear pattern. The regression line (y = 27,771.3x + 4.166B) has a positive slope, but the scatter around it is substantial.
2. Strength, Direction, and Statistical Confidence
The correlation coefficient (r = 0.402) indicates a modest positive relationship, and r² = 0.162 means only about 16% of the variance in BTC volume is explained by equities volume — leaving 84% attributable to other factors. The 95% CI [0.293, 0.501] is reasonably tight and entirely positive, and the p-value (2.998E-11) is highly significant, confirming this correlation is not due to chance in this sample. However, statistical significance here reflects sample size and consistency, not practical strength — an r² this low means X is a poor standalone predictor of Y.
Critically, the Granger causality test shows no significant predictive direction in either direction (X→Y: p=0.783; Y→X: p=0.089, only marginally suggestive). This means neither variable reliably leads the other in time — the correlation appears to be contemporaneous/coincidental rather than reflecting one market driving the other via lagged information transfer. This is an important distinction: a positive r does not imply that equity volume spikes forecast crypto volume spikes.
3. Notable Patterns and Outliers
Several high-Y outliers stand out — values like 21.2B, 15.7B, 13.1B, and 12.6B — occurring at relatively moderate X values (70,000–170,000), suggesting these spikes in BTC volume were driven by crypto-specific events (likely COVID-19 crash in March, or subsequent volatility events) rather than equity market activity. The single X outlier at 402,201 (roughly 4x the next-highest X values) corresponds to a Y value (15B) that's elevated but not extreme, contributing leverage to the regression without strongly confirming the trend. Excluding this point would likely reduce both the slope and r² further. The bulk of "typical" days show BTC volume between 4–7B fairly independent of X's value, suggesting a floor/baseline volume level unrelated to equity volume.
4. Confounding Factors and Caveats
- Time-series autocorrelation: Both series are daily volumes in 2020, a year dominated by the COVID-19 crash (March) and subsequent recovery — both markets experienced volume spikes around the same macro shock independently, which could produce spurious contemporaneous correlation without genuine causal linkage. - Third-variable driver: Overall market volatility/VIX, macroeconomic news, or liquidity conditions could simultaneously inflate volume in both equities and crypto markets, explaining the modest positive r without direct interaction. - Non-stationarity: Volume series often trend or have volatility clustering; the Granger test's "optimal lag = 10" suggests attempts to capture delayed effects, but the non-significant result implies stationarity/trend removal may be needed for cleaner inference. - Outlier leverage: The extreme X point and multiple high-Y points disproportionately influence the linear r² and slope estimates.
5. Suggested Next Steps
1. Re-run correlation after removing/winsorizing outliers (especially the 402K X-point and the 12B Y-points) to see if the relationship holds or was outlier-driven. 2. Test with log-transformed volumes, since financial volume data is typically right-skewed and log-scaling often reveals cleaner linear relationships. 3. Segment by market regime (pre-COVID, crash, recovery) since pooling a turbulent year may mask regime-specific dynamics. 4. Investigate common macro drivers (e.g., VIX, USD liquidity, stimulus announcements) as mediating variables rather than assuming a direct equities→crypto link. 5. Given the lack of Granger causality, avoid using this pairing for predictive trading models; treat the observed r as descriptive/contemporaneous only, not a forecasting signal.
X dataset: CryptoDataDownload – Binance BTC/USDT Daily OHLCV
Y dataset: Cboe U.S. Equities Historical Market Volume Data 2020
Part of experiment: Bitcoin - CryptoDataDownload – Binance BTC/USDT Daily OHLCV vs Cboe U.S. Equities Historical Market Volume Data 2020