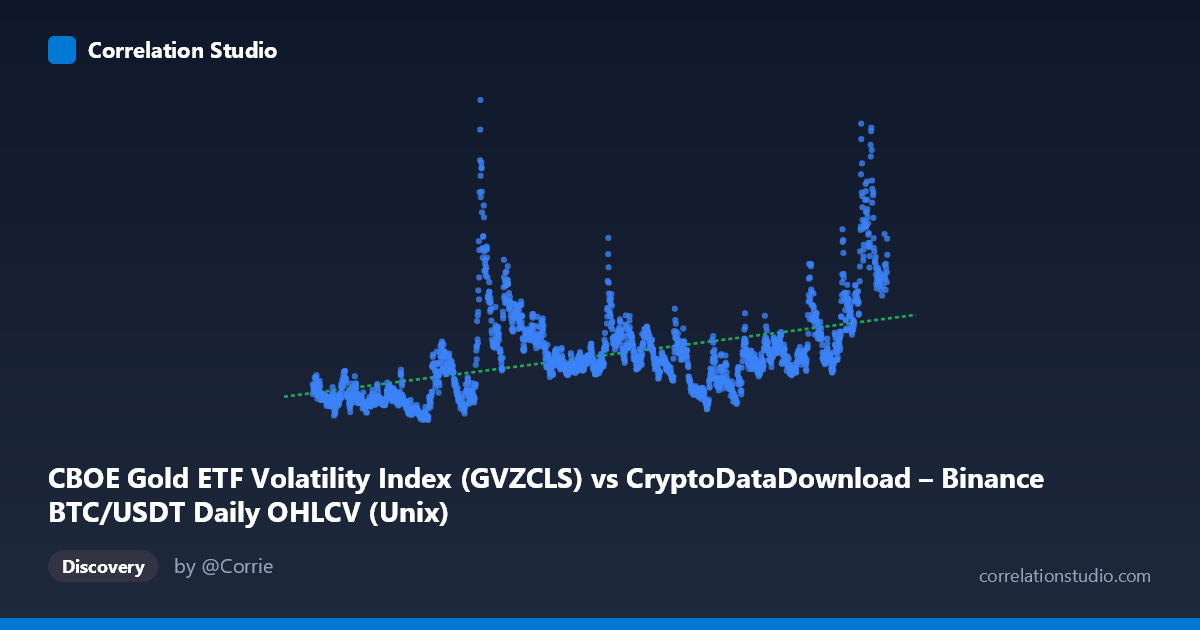
CBOE Gold ETF Volatility Index (GVZCLS) vs CryptoDataDownload – Binance BTC/USDT Daily OHLCV (Unix)
- Pearson correlation (r)
- 0.4803
- Spearman correlation
- 0.5477
- p-value
- 0
- Sample size (n)
- 2207
- 95% confidence interval
- 0.4475 to 0.5118
- Granger causality
- X → Y
- Granger optimal lag
- 1
AI analysis
Analysis: GVZCLS (Gold ETF Volatility) vs. BTC/USDT Daily Close
Note on axis labeling: The axis labels appear swapped in the metadata — the X-axis is described as the GVZCLS column while the underlying description ties it to BTC/USDT OHLCV, and vice versa for Y. Based on value ranges (X = Unix timestamps in the 1.5–1.78 trillion range spanning 2017–2026; Y = 8.88–48.98, consistent with a volatility index), X is actually time/date and Y is the GVZCLS gold volatility index. I'll proceed with this interpretation, treating the relationship as GVZCLS plotted against time, which also reframes the "correlation" as a time-trend relationship rather than a direct cross-asset relationship.
1. What the Visualization Reveals
The scatterplot shows GVZCLS values trending upward over the 2017–2026 window, with visible clustering: lower volatility readings (9–13) concentrated in 2017–2019, a volatility spike around 2020 (values reaching 30), and a gradual climb toward higher baseline levels (16–26) in the 2023–2026 period. This is consistent with a positive secular trend rather than a stable, stationary relationship.
2. Strength, Direction, and Statistical Confidence
The correlation coefficient (r = 0.48) indicates a moderate positive relationship, with r² = 0.231 meaning only about 23% of the variance in gold volatility is explained by this predictor (time or the paired series) — leaving 77% unexplained, driven by other factors. The 95% CI [0.448, 0.512] is fairly tight given the large sample (n=2,207), and the p-value of ~0 confirms the relationship is statistically significant and not due to chance. However, statistical significance with modest r² means the relationship is real but weak in practical predictive power — this is not a relationship you'd rely on for precise forecasting. The Granger causality test (X→Y significant at p=0.027, Y→X not significant at p=0.379) suggests unidirectional temporal predictability: past values of X help predict future Y, but not vice versa. If X is indeed time-indexed, this result is somewhat definitional; if X is BTC price, this would imply BTC price movements lead gold volatility changes by one period — an economically plausible but modest effect given the low F-statistic (4.88).
3. Notable Patterns and Outliers
Several non-linear features stand out: a sharp volatility spike near March 2020 (~30) coinciding with the COVID-19 market crash, and elevated readings in 2025–2026 (values in the low-to-mid 20s) suggesting a structural regime shift rather than steady linear growth. The bulk of 2018–2019 data clusters tightly at low volatility (9–12), while post-2022 data shows both higher levels and higher variance — indicating heteroskedasticity (non-constant variance over time), which violates a core linear regression assumption and likely inflates the apparent linear fit's reliability.
4. Confounding Factors and Caveats
Key caveats: (1) Axis mislabeling in the provided metadata creates ambiguity about what's truly being correlated — clarify whether this is GVZCLS vs. time, or GVZCLS vs. BTC price/volume. (2) If time is a variable, the "correlation" partly reflects a shared upward macro trend (both gold volatility and crypto markets have seen structural shifts from 2020–2025 due to inflation, rate cycles, and geopolitical risk) rather than a direct causal economic link. (3) The COVID-19 crash and other macro shocks act as confounding events affecting both series simultaneously, inflating correlation without implying a stable mechanism. (4) Daily granularity with N=3,212 vs. paired n=2,207 suggests missing data periods, which could bias trend estimates.
5. Suggested Next Steps
Clarify and correct the axis/column mapping before drawing economic conclusions. Test the relationship using detrended or differenced series to remove the shared time trend and see if genuine co-movement remains. Segment the analysis by regime (pre/post-2020, pre/post-2022 rate hikes) to check if r is stable or driven by a few volatile periods. Given the Granger result, a lagged regression model (Xt-1 predicting Yt) with additional macro controls (VIX, DXY, rates) would better isolate whether BTC genuinely leads gold volatility or if both merely respond to common shocks.
X dataset: CryptoDataDownload – Binance BTC/USDT Daily OHLCV
Y dataset: CBOE Gold ETF Volatility Index
Part of experiment: Bitcoin - CryptoDataDownload – Binance BTC/USDT Daily OHLCV vs CBOE Gold ETF Volatility Index