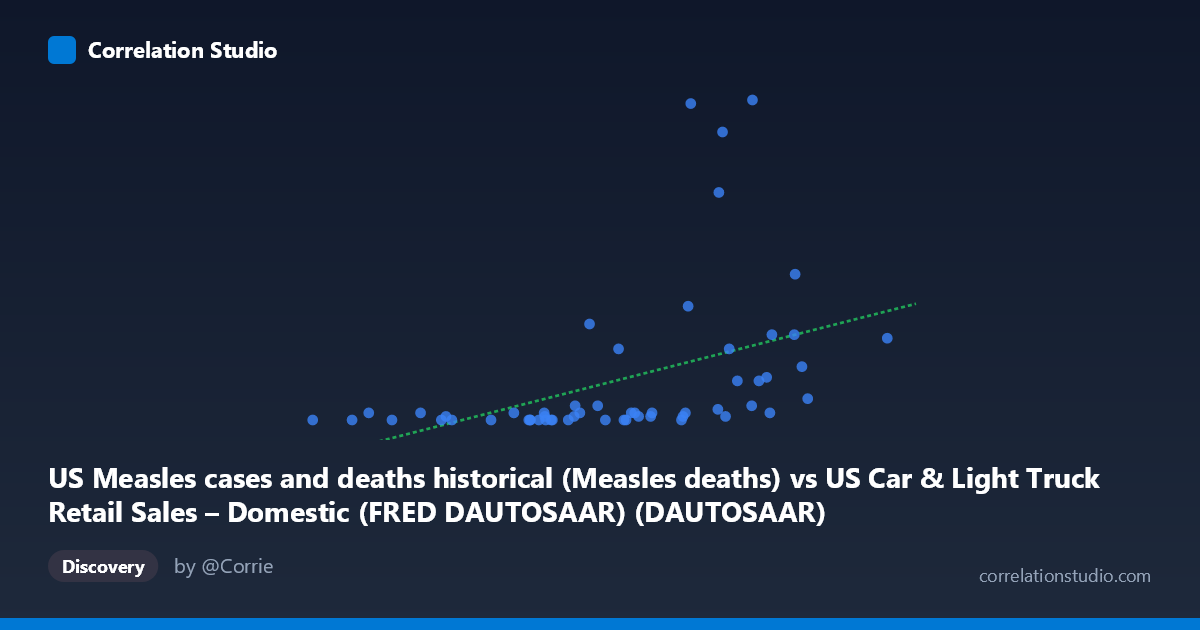
US Measles cases and deaths historical (Measles deaths) vs US Car & Light Truck Retail Sales – Domestic (FRED DAUTOSAAR) (DAUTOSAAR)
- Pearson correlation (r)
- 0.427
- Spearman correlation
- 0.7064
- p-value
- 0.00103
- Sample size (n)
- 56
- 95% confidence interval
- 0.1849 to 0.6203
- Granger causality
- X → Y
- Granger optimal lag
- 9
- Time coverage
- 1967-01-01 to 2022-01-01
- Recomputed on refreshed data
- 2026-10-20 (r was 0.427)
AI analysis
Scatterplot Analysis: US Measles Deaths vs. Domestic Auto Sales
1. Overall Relationship and Visualization
The scatterplot reveals a weakly positive association between US measles deaths (X-axis) and domestic auto retail sales (Y-axis), with most data points clustering heavily near the lower left — particularly at very low measles death counts (0–2) paired with a wide range of auto sales figures. The linear regression line (y = 5.16x − 21.71) has a positive slope, but the visual impression is dominated by extreme scatter and a handful of high-leverage outliers in the upper range. The relationship is far from clean, and the raw plot immediately suggests that a simple linear model is an inadequate description of whatever structure exists.
2. Correlation Strength, Direction, and Granger Causality
The Pearson r of 0.427 indicates a modest positive correlation, but the r² of 0.182 tells the more sobering story: only ~18% of variance in auto sales is explained by measles deaths, leaving over 80% unexplained. The 95% confidence interval for r spans [0.185, 0.620], a wide band reflecting meaningful uncertainty about the true population relationship. The p-value of 0.001 confirms the correlation is statistically distinguishable from zero at conventional thresholds, but statistical significance here is largely a function of sample size (N=105), not practical meaningfulness. The Granger causality result — that measles deaths unidirectionally predict future auto sales with a 9-period lag (F=2.37, p=0.039) — is technically noteworthy, but this almost certainly reflects shared temporal trends rather than any causal mechanism. Both series trend strongly over the 1967–2022 timeframe in ways that would naturally produce spurious predictive relationships.
3. Patterns, Clusters, and Outliers
Several features stand out visually: - Dense floor cluster: The vast majority of points sit near Y=0–5, regardless of X value, creating a near-horizontal mass that dominates the distribution - High-leverage outliers: Points like (7.84, 81), (8.26, 90), (7.39, 89), and (7.79, 64) exert disproportionate influence on the regression line and are largely responsible for the positive slope - Non-linear signal: The Spearman ρ exceeding Pearson r explicitly flags a non-linear underlying relationship — the data pattern (flat floor with sporadic high values) is more consistent with a threshold or exponential-like structure than a linear one - Heteroscedasticity: Variance in Y increases substantially at higher X values, violating linear regression assumptions
4. Confounding Factors and Caveats
This correlation is a textbook candidate for spurious correlation driven by shared secular trends. Measles deaths declined dramatically across the 20th century due to vaccination (1963 MMR introduction), while auto sales fluctuated with economic cycles and population growth over the same period. Both series are non-stationary time series whose long-run trends can manufacture statistical associations with virtually any other trending variable. The 9-period Granger lag may simply capture common economic or demographic cycles rather than any meaningful predictive relationship. Additionally, the dataset combines very different historical eras (pre- and post-vaccination), making the population fundamentally heterogeneous. Annual aggregation also masks within-year dynamics.
5. Actionable Insights and Further Investigation
This correlation should not be interpreted as causal or practically meaningful in any direct sense. However, several investigative steps would be worthwhile: - Detrend both series (first-differencing or HP filter) before re-running correlation and Granger tests to remove spurious trend-driven associations - Test non-linear models (logarithmic, polynomial) as flagged by the Spearman/Pearson divergence, since the data structure clearly does not support a linear fit - Segment by era (pre-1963 vs. post-1963 vaccination) to test whether the correlation structure changes fundamentally across regimes - Identify the true confounders — GDP, population, public health spending — that likely drive both variables independently - Consider whether the outlier cluster (high measles deaths and high auto sales) corresponds to specific historical years that share a common economic or demographic explanation
X dataset: US Car & Light Truck Retail Sales – Domestic (FRED DAUTOSAAR)
Y dataset: US Measles cases and deaths historical
Part of experiment: Yearly - US Car & Light Truck Retail Sales – Domestic (FRED DAUTOSAAR) vs US Measles cases and deaths historical