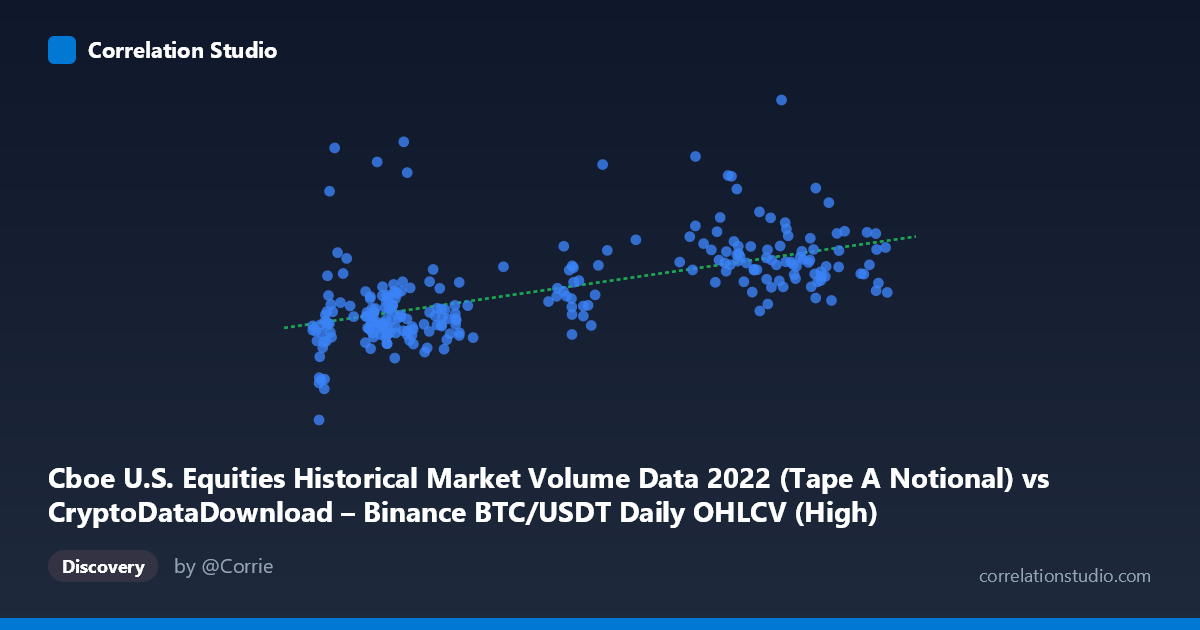
Cboe U.S. Equities Historical Market Volume Data 2022 (Tape A Notional) vs CryptoDataDownload – Binance BTC/USDT Daily OHLCV (High)
- Pearson correlation (r)
- 0.596
- Spearman correlation
- 0.6554
- p-value
- 0
- Sample size (n)
- 251
- 95% confidence interval
- 0.5098 to 0.6704
- Granger causality
- None
- Granger optimal lag
- 10
- Time coverage
- 2022-01-03 to 2022-12-30
AI analysis
Analysis: Cboe Equity Volume vs. BTC/USDT Daily High
1. What the Visualization Shows
The scatterplot depicts a positive, moderately noisy relationship between U.S. equities market volume (notional value, Tape A) and Bitcoin's daily high price on Binance across 2022. Points show a general upward drift — as equity trading volume increases, BTC prices tend to be higher as well — but the dispersion around any fitted trend line is substantial, indicating that volume alone is a weak-to-moderate predictor of BTC price levels.
2. Strength, Direction, and Statistical Confidence
The correlation coefficient (r = 0.596) indicates a moderate positive linear relationship, with r² = 0.355 meaning only about 35.5% of the variance in BTC's daily high is explained by equity volume — the majority (nearly two-thirds) of BTC price movement is driven by other factors entirely. The 95% confidence interval [0.510, 0.670] is reasonably tight and excludes zero, and the p-value (~0) confirms this correlation is statistically significant and not due to chance in this sample. However, statistical significance should not be conflated with practical predictive power given the modest r². Critically, the Granger causality tests show no significant predictive direction in either direction (X→Y: p=0.813; Y→X: p=0.980) even at an optimal lag of 10 periods. This strongly suggests the correlation is contemporaneous/coincidental rather than causal or lead-lag — neither series helps forecast the other's future values.
3. Notable Patterns and Outliers
The data shows a rough clustering into two regimes: a lower-X cluster (~16,000–25,000 equity volume) with BTC prices mostly in the $7.4B–$10B range, and a higher-X cluster (~30,000–48,000) with BTC prices spanning a much wider band, from ~$9B up to the maximum of $20B. This suggests heteroscedasticity — variance in Y increases with X — which likely inflates the linear r² estimate while masking a weaker underlying relationship at low volumes. There are also visible outliers: points like (21365, $17.9B) and (21558, $16.3B) show high BTC prices at relatively low equity volume, and (42325, $20.09B) is the single highest Y value, worth flagging as a potential leverage point. These outliers appear disconnected from the main trend and could be driving part of the correlation.
4. Confounding Factors and Caveats
Both series are influenced by common macro drivers — Fed rate decisions, inflation data, risk-on/risk-off sentiment, and general 2022 market volatility (crypto crash, equity bear market) — that could independently push both equity volume and BTC prices without any direct causal link between them. Additionally, both are time series with likely autocorrelation (trending, seasonality, volatility clustering), which can artificially inflate correlation estimates computed via standard Pearson methods that assume independence. The mismatch between N (3,212, full population) and n (251, sampled) also means the correlation stats are based on a subsample, introducing sampling variability not fully captured by the CI shown. Lastly, comparing a crypto asset price (high) to equity volume (not equity price) is an unusual pairing — economically, the more intuitive link would be equity price/index level vs. BTC price, or volume vs. volume, so the specific relationship tested may not reflect a meaningful economic mechanism.
5. Recommendations for Further Investigation
Given the lack of Granger causality, this correlation should not be used for predictive trading signals in either direction. Instead, analysts should: (1) test for a shared latent factor (e.g., include VIX, DXY, or Fed rate decision dates) that may explain both series' co-movement; (2) de-trend or difference both series (returns instead of levels) to reduce spurious correlation from shared trends and re-run correlation/Granger tests; (3) investigate the identified outliers to check whether they correspond to major macro events (e.g., FTX collapse, CPI releases) that could be excluded or treated separately; and (4) test equity price/index against BTC price, and equity volume against BTC volume, as more theoretically grounded pairings.
X dataset: CryptoDataDownload – Binance BTC/USDT Daily OHLCV
Y dataset: Cboe U.S. Equities Historical Market Volume Data 2022
Part of experiment: Bitcoin - CryptoDataDownload – Binance BTC/USDT Daily OHLCV vs Cboe U.S. Equities Historical Market Volume Data 2022