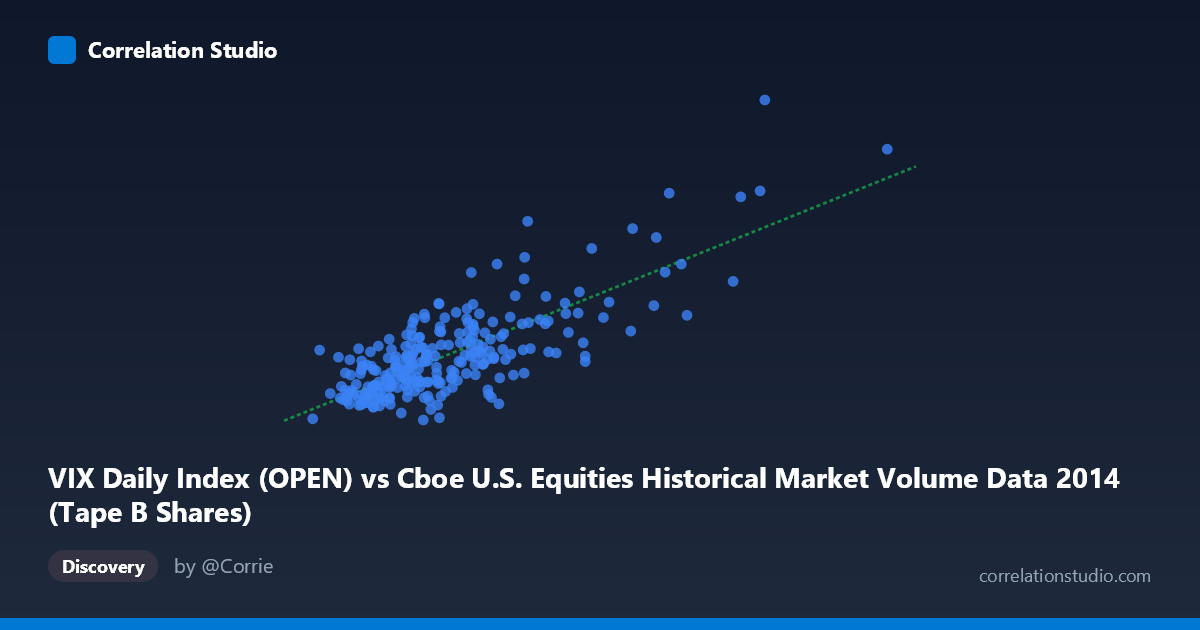
VIX Daily Index (OPEN) vs Cboe U.S. Equities Historical Market Volume Data 2014 (Tape B Shares)
- Pearson correlation (r)
- 0.7725
- Spearman correlation
- 0.6587
- p-value
- 0
- Sample size (n)
- 252
- 95% confidence interval
- 0.7174 to 0.818
- Granger causality
- None
- Granger optimal lag
- 1
AI analysis
Scatterplot Analysis: VIX Daily Index (OPEN) vs. Tape B Shares (2014)
Overall Relationship The scatterplot reveals a moderately strong positive relationship between the VIX Daily Index opening values and Tape B share volume across U.S. equities exchanges in 2014. As the VIX rises — reflecting increasing market fear and uncertainty — Tape B share volumes tend to climb correspondingly. The linear regression equation (y = 8.63×10⁻⁸x + 7.73) confirms this upward trend, suggesting that higher volatility environments are associated with meaningfully elevated trading activity on Tape B venues. This is conceptually intuitive: periods of market stress typically drive reactive buying, selling, and hedging behavior, boosting overall volume across exchanges.
Correlation Strength and Statistical Significance The correlation coefficient of r = 0.7725 indicates a strong positive association, and the r² of 0.5967 means that approximately 59.7% of the variance in Tape B share volume is explained by the VIX open. While substantial, this also means roughly 40% of variance remains unexplained by VIX alone, pointing to other meaningful drivers at work. The 95% confidence interval [0.7174, 0.8180] is relatively tight, lending credibility to this estimate, and the p-value of effectively zero confirms the relationship is highly statistically significant across the full population of N = 3,686 trading observations. However, the Granger causality results complicate the narrative significantly: neither direction (X→Y: F = 0.6368, p = 0.4256; Y→X: F = 0.0130, p = 0.9093) achieves significance at lag 1. This means that despite the strong contemporaneous correlation, neither variable reliably predicts the other the following day — the relationship is synchronous rather than sequentially predictive, limiting its utility for day-ahead forecasting.
Notable Patterns, Clusters, and Outliers The sample points reveal a notable concentration of data in the lower-left region of the chart — particularly in the X range of roughly 50–90 million (VIX opens between ~10–16), representing the relatively calm baseline trading environment that dominated most of 2014. A distinct cluster of high-VIX, high-volume outliers is visible in the upper-right, with points like (162,525,288, 29.26) and (155,911,936, 23.55) standing out dramatically from the main data cloud. These likely correspond to specific volatility episodes in late 2014, including the October market correction driven by Ebola fears, geopolitical tensions, and oil price collapse. The relationship also appears to show mild heteroscedasticity — variance in Tape B volume appears to widen at higher VIX levels — suggesting the linear model may underfit the extremes and that a log-linear or polynomial specification could be more appropriate.
Confounding Factors and Caveats Several important caveats apply before drawing causal conclusions. First, both variables are driven by common macroeconomic shocks — events like Federal Reserve announcements, geopolitical crises, or earnings seasons simultaneously spike the VIX and trading volumes, creating spurious co-movement that is not causal. Second, the Granger non-causality finding at lag 1 is a meaningful warning that this is a coincident, not leading, relationship. Third, Tape B specifically covers NYSE American (AMEX) and regional exchange-listed securities, which may respond differently to volatility than Tape A or C securities, limiting generalizability. Finally, the data covers only 2014 — a relatively low-volatility year by historical standards — meaning the relationship parameters could shift substantially in crisis years like 2008 or 2020.
Actionable Insights and Further Investigation Practitioners could use the contemporaneous VIX level as a real-time signal for expected Tape B volume conditions within a trading day, useful for liquidity modeling and execution strategy calibration. However, the lack of Granger causality advises against using prior-day VIX to forecast next-day volume. For further investigation, it would be valuable to: (1) extend the time series across multiple years to test relationship stability across different volatility regimes; (2) test longer Granger lags (2–5 periods) to detect slower predictive dynamics; (3) compare Tape A and Tape C responses to VIX to determine whether Tape B is uniquely sensitive; and (4) apply a regime-switching or quantile regression model to better capture the apparent non-linearity at high-VIX extremes, where the linear approximation appears most strained.
X dataset: Cboe U.S. Equities Historical Market Volume Data 2014
Y dataset: VIX Daily Index
Part of experiment: Daily - Cboe U.S. Equities Historical Market Volume Data 2014 vs VIX Daily Index